Project Overview
The Airline Intelligence Platform is a personal end-to-end data engineering and analytics project that transforms raw U.S. Bureau of Transportation Statistics (BTS) On-Time Performance data into a structured, insight-ready analytics system.
The project covers the full data lifecycle — from raw CSV ingestion through a three-layer medallion architecture, all the way to exploratory analysis, delay attribution, and a regression model that quantifies the key operational drivers of arrival delays.
Key Goals
- Build a production-style medallion ETL pipeline (Bronze → Silver → Gold)
- Profile data quality and document structural null patterns
- Derive operational KPIs across 3 million flight records
- Identify temporal, carrier, and airport delay patterns
- Quantify delay root causes with attribution analysis
- Build and interpret a linear regression model for arrival delay
Dataset
Key fields include flight date, origin/destination airport, carrier code, scheduled and actual departure/arrival times, delay minutes broken out by five BTS cause categories (Carrier, Late Aircraft, NAS/ATC, Weather, Security), and cancellation/diversion flags.
Pipeline Architecture
The platform follows a medallion (lakehouse) architecture, separating ingestion, cleaning, and aggregation concerns into three distinct layers:
The Silver layer is the central fact table — every downstream analysis and the regression model reads from fact_flights.parquet. The Gold marts pre-aggregate at airport, route, and carrier grain to power summary-level analytics without repeated full-scan computation.
Data Quality Assessment
Before analysis, the pipeline runs automated quality checks across all key columns. Notable findings:
- Core identity columns (flight_date, carrier, origin, dest) — 0 % null; always present.
- Delay-cause columns (5 BTS categories) — 82.2 % null. This is a structural BTS design choice: these fields are only populated for delayed, non-cancelled flights. This is not a data defect.
- arr_delay_min / air_time_min — 2.87 % null, limited to cancelled and some diverted flights.
- Delay range: arrival delay spans −96 min (early) to +2,934 min. Extreme maxima represent real multi-day disruptions and are retained.
All quality findings are documented in the Silver layer transformation notebook and inform downstream null-aware aggregation logic.
Operational KPIs
The following headline metrics are derived from the full 3-million-flight Silver fact table:
Roughly 1 in 6 flights experiences a meaningful delay (≥ 15 min), and roughly 1 in 17 experiences a severe delay (≥ 60 min). The median flight actually arrives 7 minutes early — a testament to airline schedule padding — but the tail of severe delays is long.
Temporal Patterns
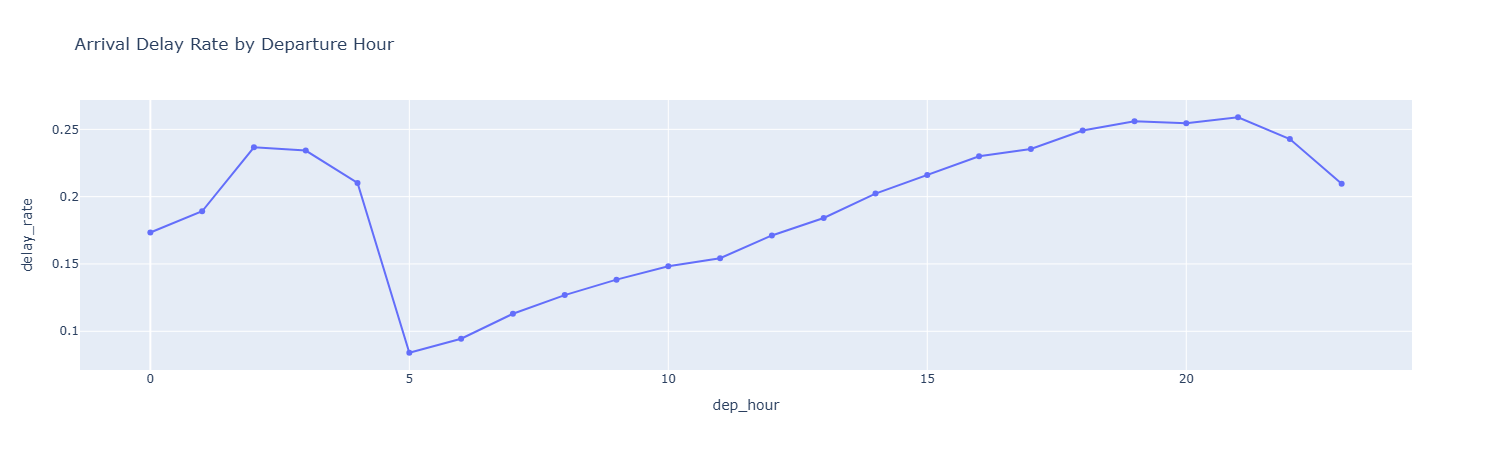
Hour of Day
Delay rates follow a pronounced intra-day curve driven by schedule propagation (the "rotation effect"):
- 05:00–07:00: Lowest delay rates — aircraft are freshly positioned, minimal upstream propagation.
- 15:00–20:00: Peak delay window — hours of compounding upstream delays across the network push afternoon/evening flights significantly later.
- 21:00+: Moderate improvement as traffic thins out.
Passengers and operations planners can expect 2–3× higher delay risk for afternoon/evening departures versus early-morning slots.
Day of Week
- Friday — highest delay risk (peak travel demand + maximum schedule stress).
- Saturday — lowest delay risk (reduced business travel, lighter congestion).
- Monday & Sunday — moderate-to-high (network restart and return-travel surges).
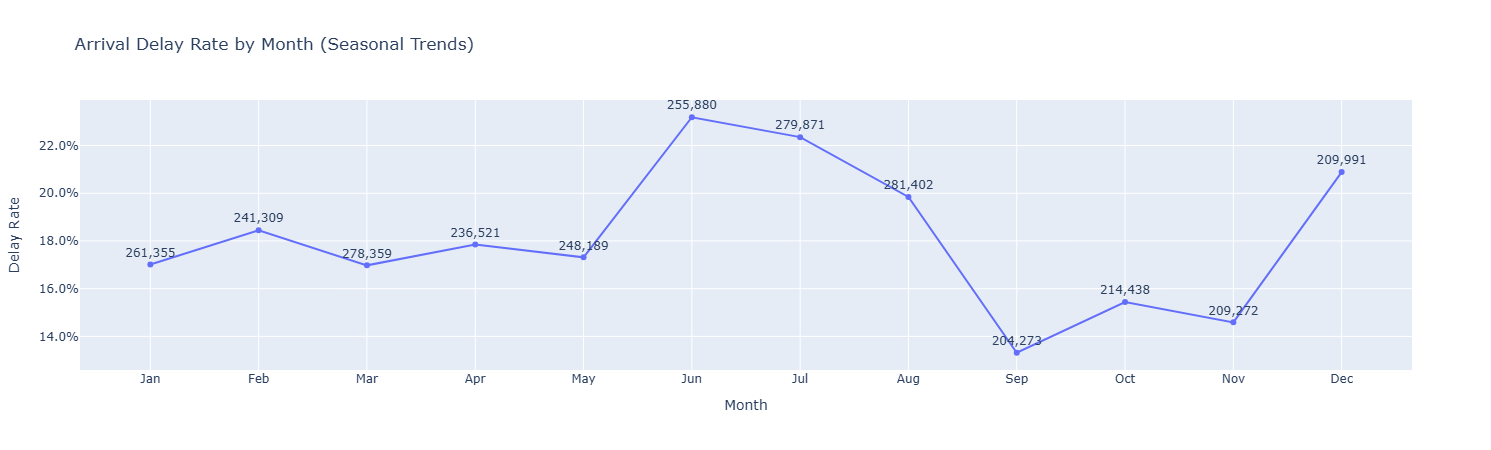
Seasonal Patterns
Delay rates peak in June–July (summer thunderstorm season + vacation traffic) and December–January (winter weather events). The lowest-delay windows are September–October, offering the most operationally predictable flying conditions.
Airport & Route Performance
Busiest Hubs (Top 5 by Volume)
| Airport | Total Flights |
|---|---|
| ATL (Hartsfield-Jackson) | 307,125 |
| DFW (Dallas/Fort Worth) | 260,104 |
| ORD (Chicago O'Hare) | 245,630 |
| DEN (Denver) | 239,511 |
| CLT (Charlotte) | 189,717 |
ATL dominates at 307,125 flights — roughly 18 % more than second-ranked DFW — yet it performs relatively well on delay rate, demonstrating that volume alone does not determine operational reliability.
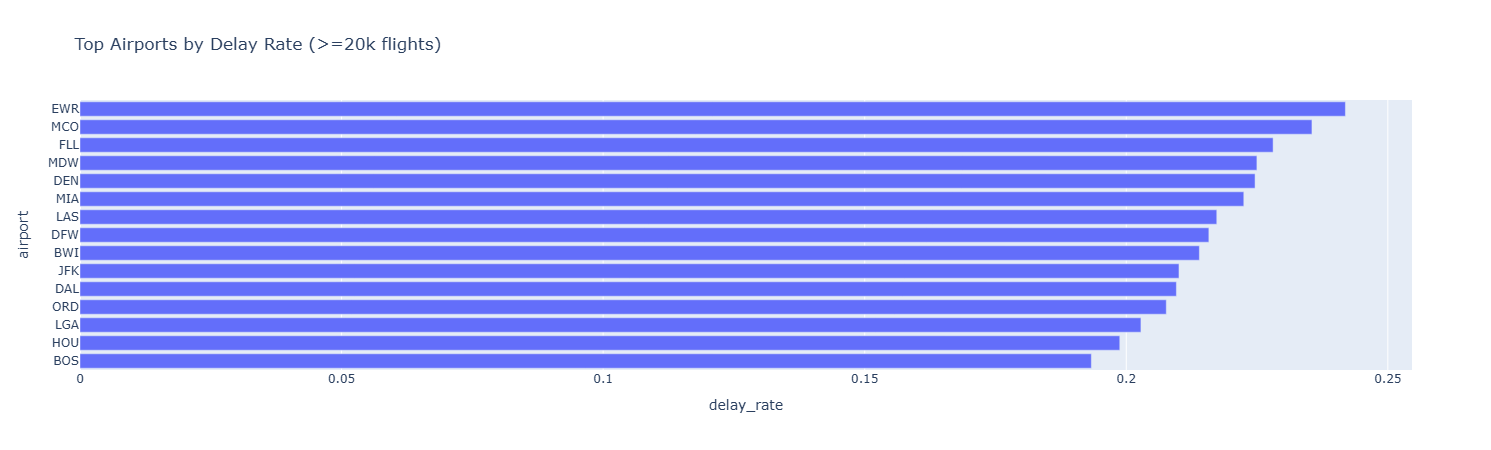
Structurally High-Delay Airports
Among high-traffic origins (≥ 20,000 flights), airports with the highest delay rates tend to share slot-constrained runways, northeast weather exposure, or high route density:
- ORD & LGA — consistently highest delay rates due to congestion and northeast weather.
- DEN & SEA — elevated winter weather delays.
- ATL & CLT — better relative performance despite very high volume.
Worst Routes
The highest-delay routes (by rate, minimum 1,000 flights) are dominated by short-haul northeast and midwest segments feeding slot-constrained hubs. These routes show both high delay rates and high average delay minutes — a signal of systemic, not incidental, issues.
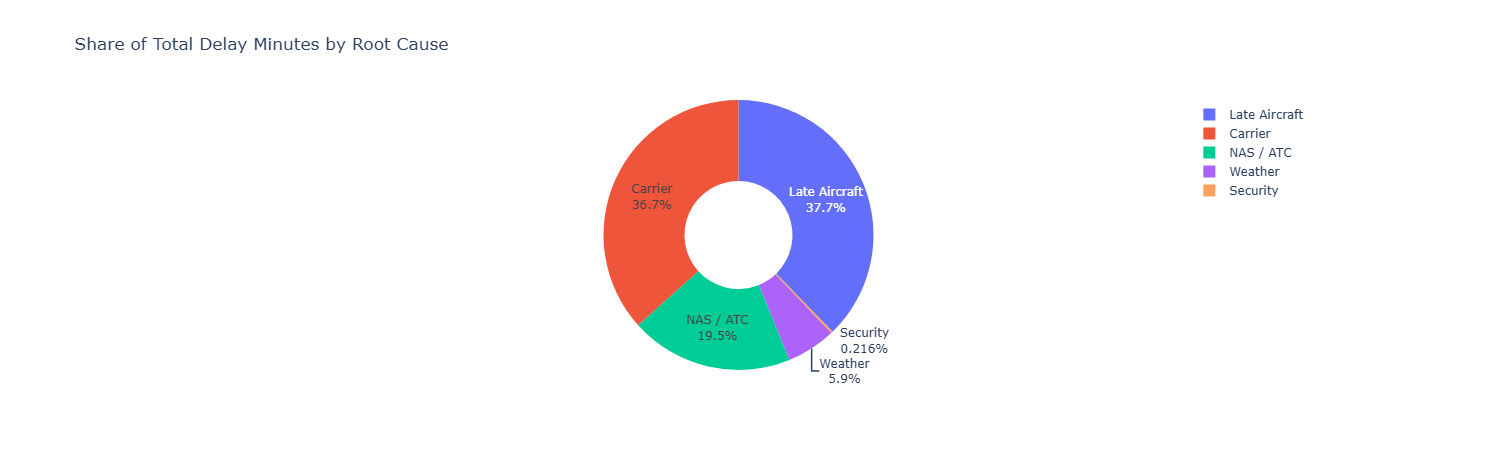
Delay Root-Cause Analysis
The BTS schema provides five official delay-cause buckets for each delayed, non-cancelled flight. System-wide contribution across the full dataset:
| Cause | Avg Delay (min) | Share of Total Delay Minutes |
|---|---|---|
| Late Aircraft | 25.47 | ~35–40 % |
| Carrier | 24.76 | ~33–37 % |
| NAS / ATC | 13.16 | ~17–20 % |
| Weather | 3.99 | ~5–8 % |
| Security | 0.15 | < 1 % |
Late Aircraft + Carrier causes together account for over 70 % of all delay minutes. This is the critical insight: the majority of delay is operational and manageable, not weather-driven or exogenous. Schedule padding, turn-around management, and rotation planning are the highest-leverage levers available to airlines.
Per-Carrier Variation
Cause mix varies meaningfully across carriers. Carriers with disproportionately high Late Aircraft share tend to run tight rotations with insufficient buffer. Those with high Carrier delay share may have maintenance scheduling or crew management inefficiencies. NAS/ATC delays are broadly uniform across carriers, reflecting shared airspace constraints.
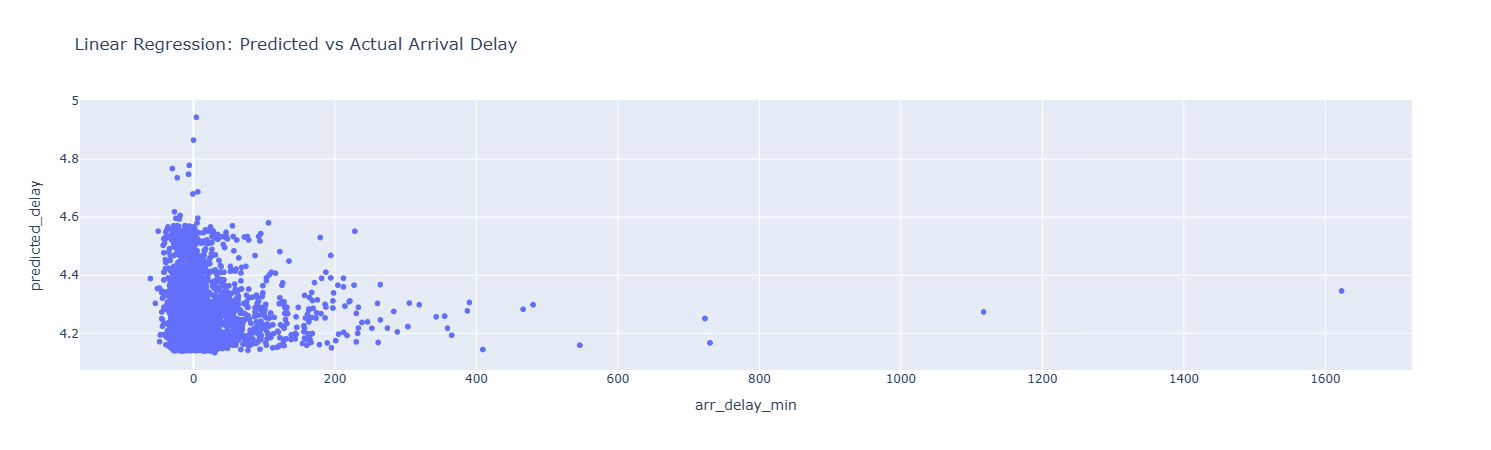
Regression Model — Arrival Delay Drivers
A linear regression model was built on the Silver fact table to quantify the marginal impact of key operational variables on arrival delay (in minutes).
Features
| Feature | Description | Expected Effect |
|---|---|---|
taxi_out_min |
Taxi-out time (proxy for surface congestion) | Positive — strongest predictor at the margin |
dep_hour |
Scheduled departure hour | Positive — later departures propagate more upstream delay |
distance_miles |
Flight distance | Weak / Negative — longer flights can recover time in the air |
Key Findings
- Taxi-out time is the strongest positive predictor — surface congestion at origin airports directly and measurably inflates arrival delay.
- Departure hour has a moderate positive relationship — consistent with the schedule propagation pattern observed in the temporal analysis.
- Distance has a weak or slightly negative relationship — longer routes offer more opportunity for airborne time recovery, partially offsetting ground-side delays.
The model captures macro directional trends; delays are complex, cascading events and a linear model explains only a fraction of total variance. It is most useful as a directional quantification tool rather than a precise prediction engine.
Key Findings & Recommendations
Summary Findings
- Late Aircraft + Carrier causes dominate — over 70 % of all delay minutes stem from controllable airline operations.
- Time-of-day is a strong predictor — afternoon/evening departures face 2–3× the delay rate of early-morning slots.
- Friday and peak-summer are highest-risk windows — consistent weekly and seasonal patterns are actionable for scheduling.
- ATL is the busiest hub but not the worst performer — volume and delay rate are not directly correlated.
- Taxi-out time is the strongest regression predictor — surface congestion is the clearest intervention point.
- Short northeast/midwest routes carry disproportionately high delay rates due to slot constraints and weather exposure.
Recommendations
| Priority | Action |
|---|---|
| High | Investigate and reduce late-aircraft turn-around chains using tail-level tracking |
| High | Introduce schedule buffers for peak afternoon/evening departures, especially on Fridays |
| Medium | Prioritise taxi-out efficiency programmes at top-10 congested airports |
| Medium | Evaluate rescheduling for the top-20 worst-performing routes |
| Low | Incorporate NOAA weather data for causal separation of weather vs. carrier delay effects |
| Low | Build carrier-level OLS models to isolate the marginal impact of schedule padding |
Outcome
This project demonstrates end-to-end ownership of a large-scale data engineering and analytics pipeline — from raw BTS CSV files through a medallion ETL architecture, exploratory analysis, delay attribution, and predictive modelling. It showcases my ability to handle 3-million-row datasets in Python, design structured analytical marts, surface operationally meaningful insights, and communicate findings clearly — core competencies for data analyst and analytics engineering roles.