Project Overview
This project is an Excel-based financial analytics solution designed to evaluate profitability, expense structure, and product performance for an e-commerce business. The workbook transforms raw transaction-level data into a structured Profit & Loss (P&L) statement, enabling year-over-year comparison and insight-driven decision making.
The goal of this project was to simulate a real consulting scenario: analyze financial stagnation and identify areas where operational costs or product mix may be impacting overall profitability.

Business Problem
The company experienced slowing profit growth despite steady sales activity. Leadership needed a clear understanding of:
- How revenue translated into actual profit after expenses
- Which cost categories were increasing year-over-year
- Which products drove volume versus profitability
- Whether operational efficiency improved between 2024 and 2025
Raw transaction data alone could not answer these questions. The data required restructuring into a financial reporting framework.
Data Structure & Modeling Approach
The workbook is organized into three analytical layers:
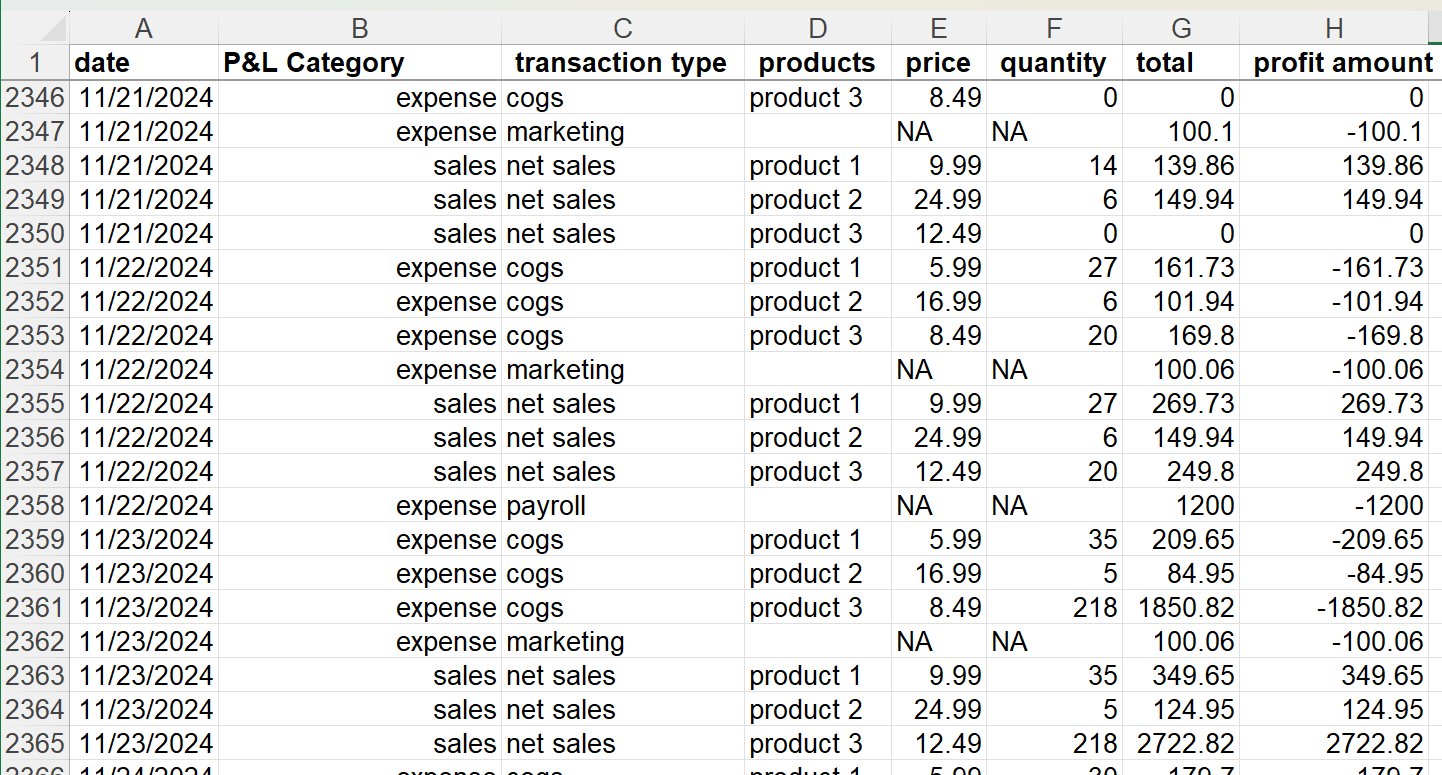
1. Transaction Layer — Data Sheet
The Data sheet contains normalized transaction records, including:
- Date
- P&L Category
- Transaction Type (Net Sales, COGS, Payroll, Marketing, Overhead, etc.)
- Product name
- Price, Quantity, and Total value
- Profit amounts (positive for revenue, negative for expenses)
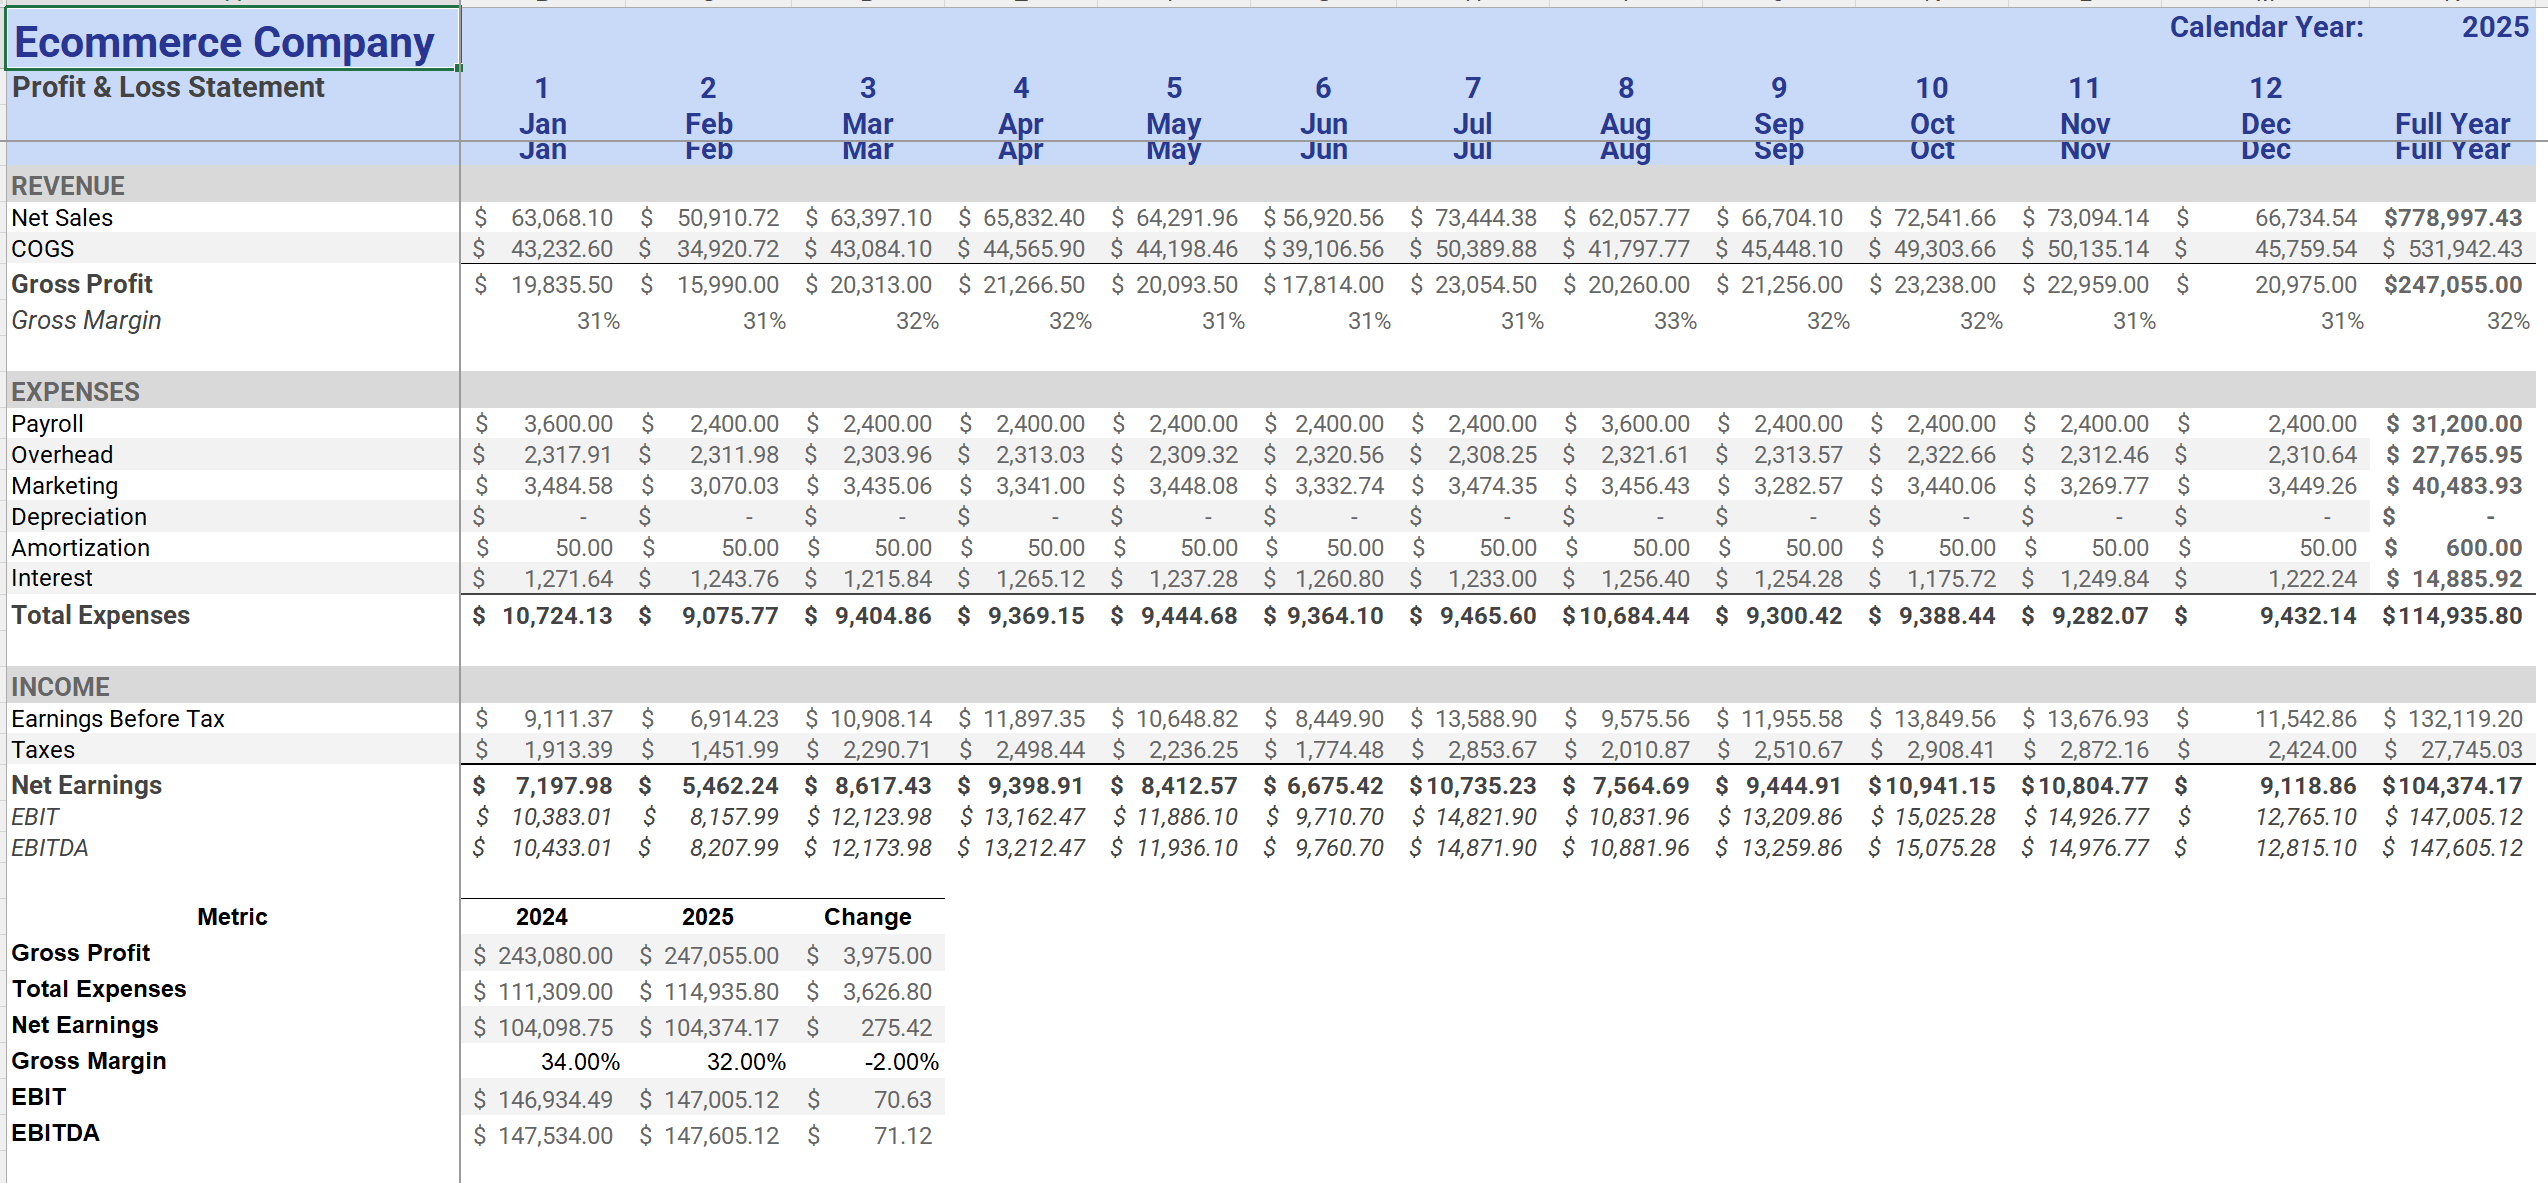
2. Financial Reporting Layer — P&L Sheet
The P&L sheet converts transactional data into a business-ready financial statement. Key metrics include:
- Net Sales
- Cost of Goods Sold (COGS)
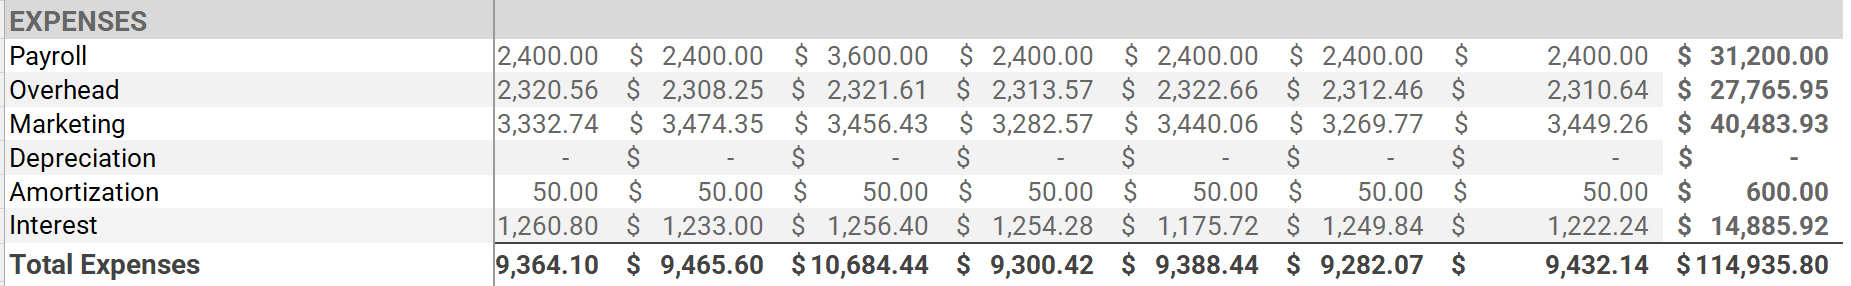
- Gross Profit & Gross Margin
- Payroll, Marketing, Overhead, Amortization, Interest
- Total Expenses
- Earnings Before Tax
- Net Earnings
- EBIT and EBITDA
Monthly totals are calculated using structured aggregation logic, allowing trends to be compared across the full fiscal year. A summary section compares performance between 2024 and 2025 to highlight changes in revenue, expenses, and margins.
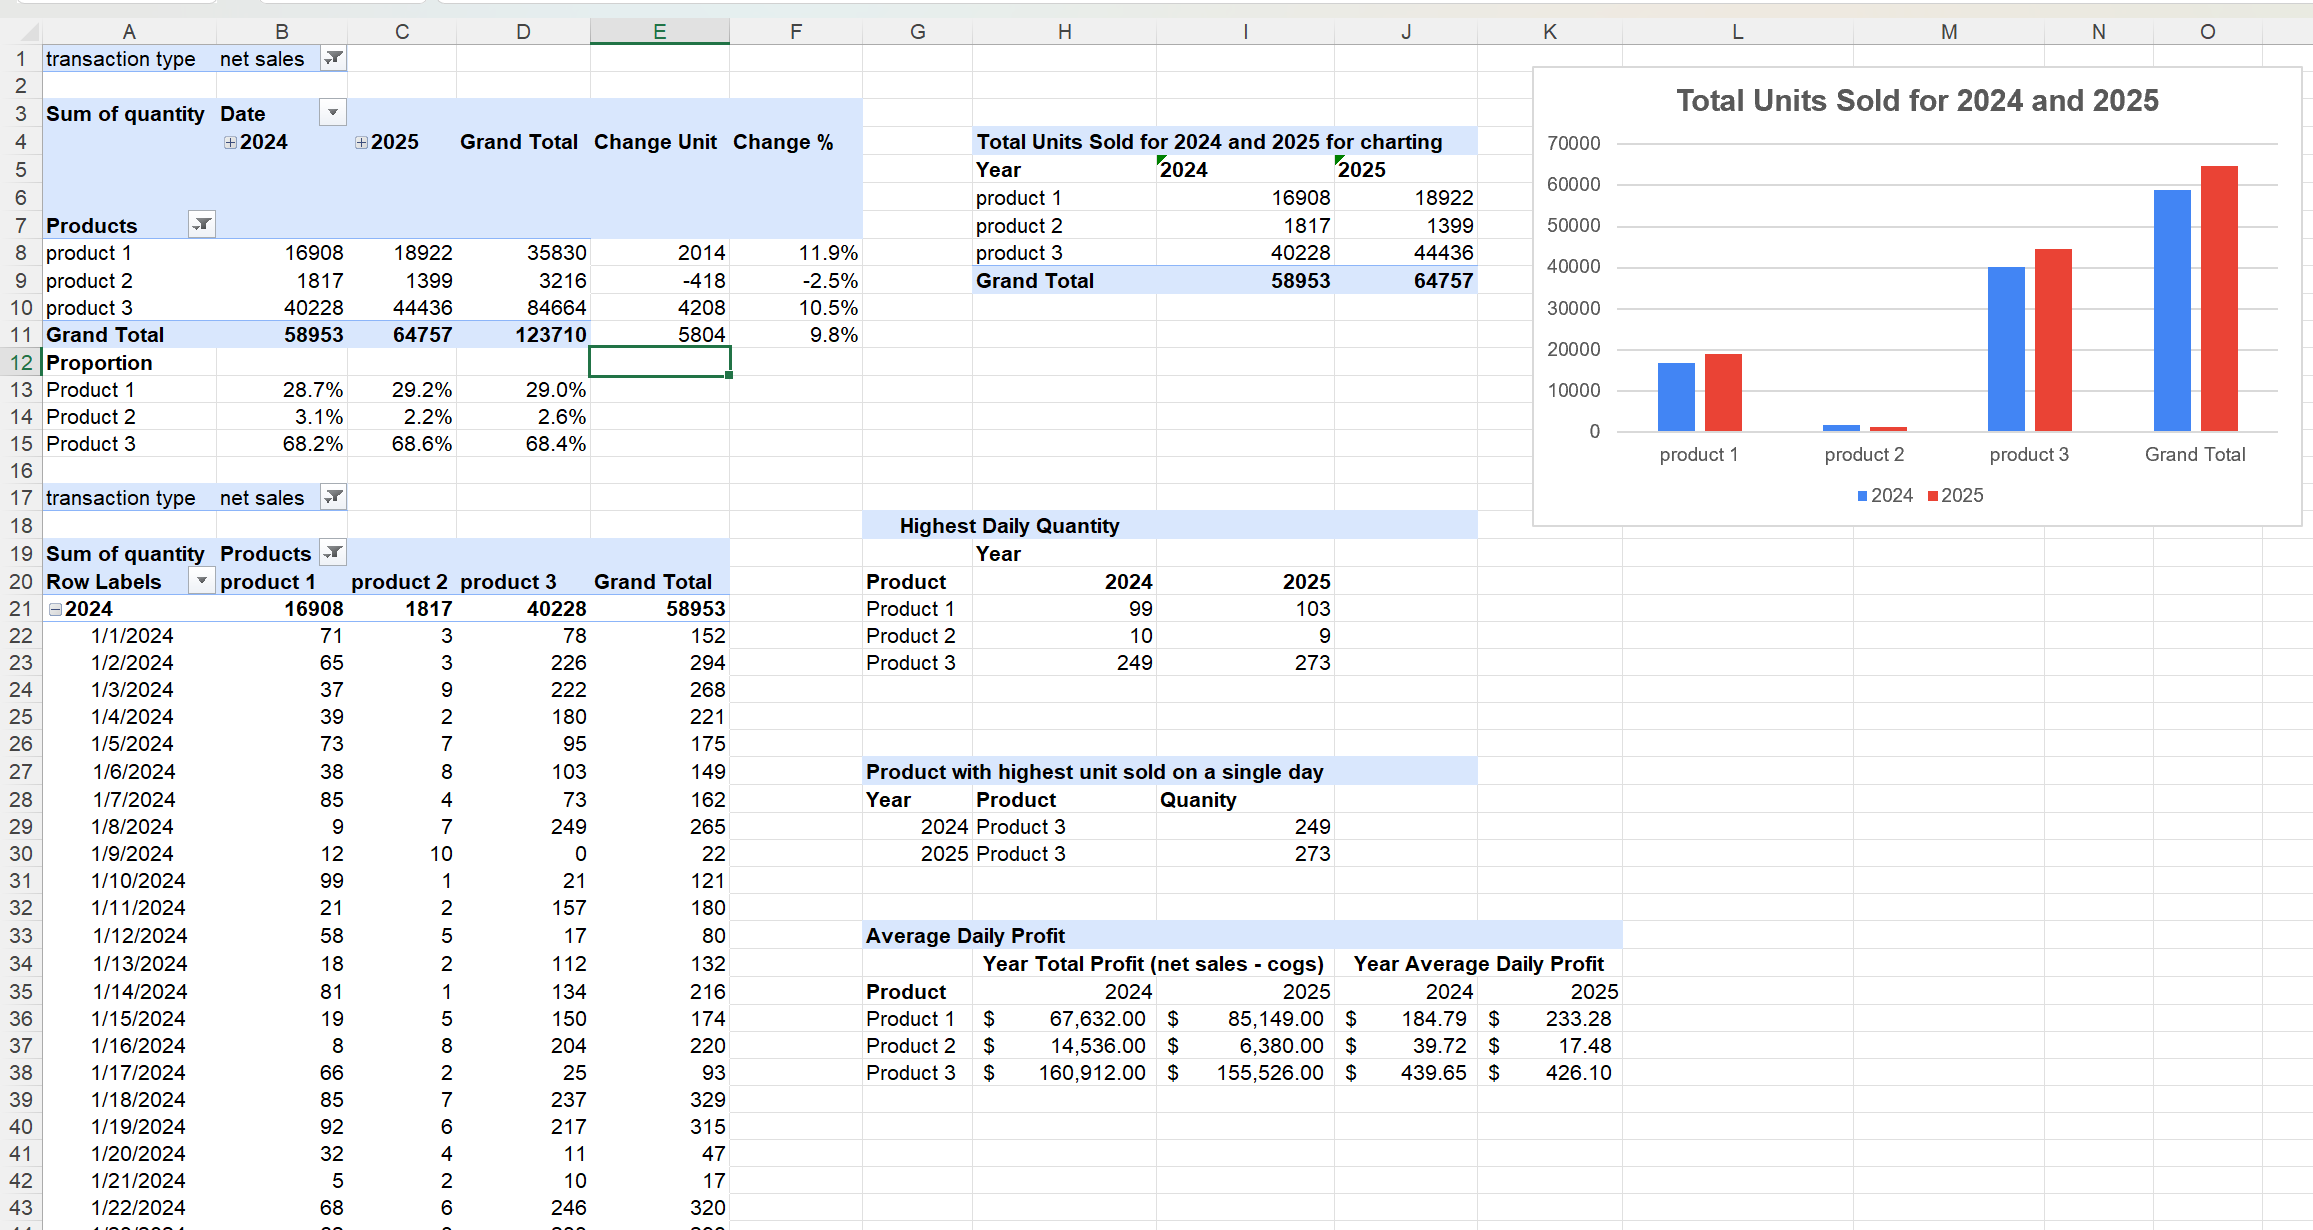
3. Product Intelligence Layer — Products Sheet
The Products sheet shifts the analysis from financial reporting to operational insight. It evaluates:
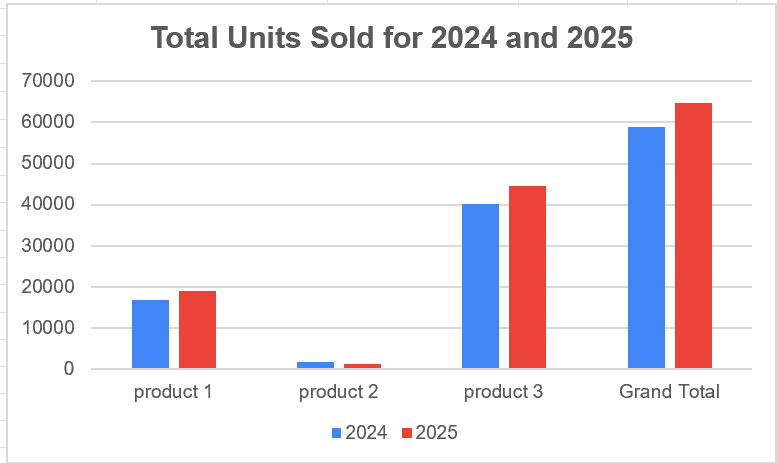
- Units sold per product (2024 vs 2025)
- Product mix percentage
- Year-over-year volume change
- Highest daily sales performance
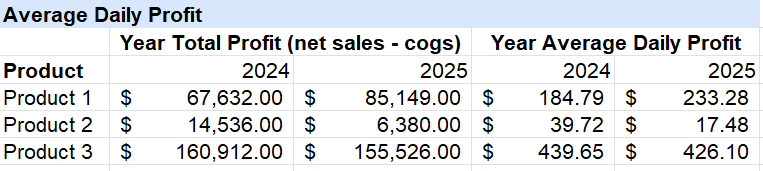
- Total yearly profit by product
- Average daily profit contribution
This allows stakeholders to identify whether high-volume products also generate meaningful profit.
Technical Implementation
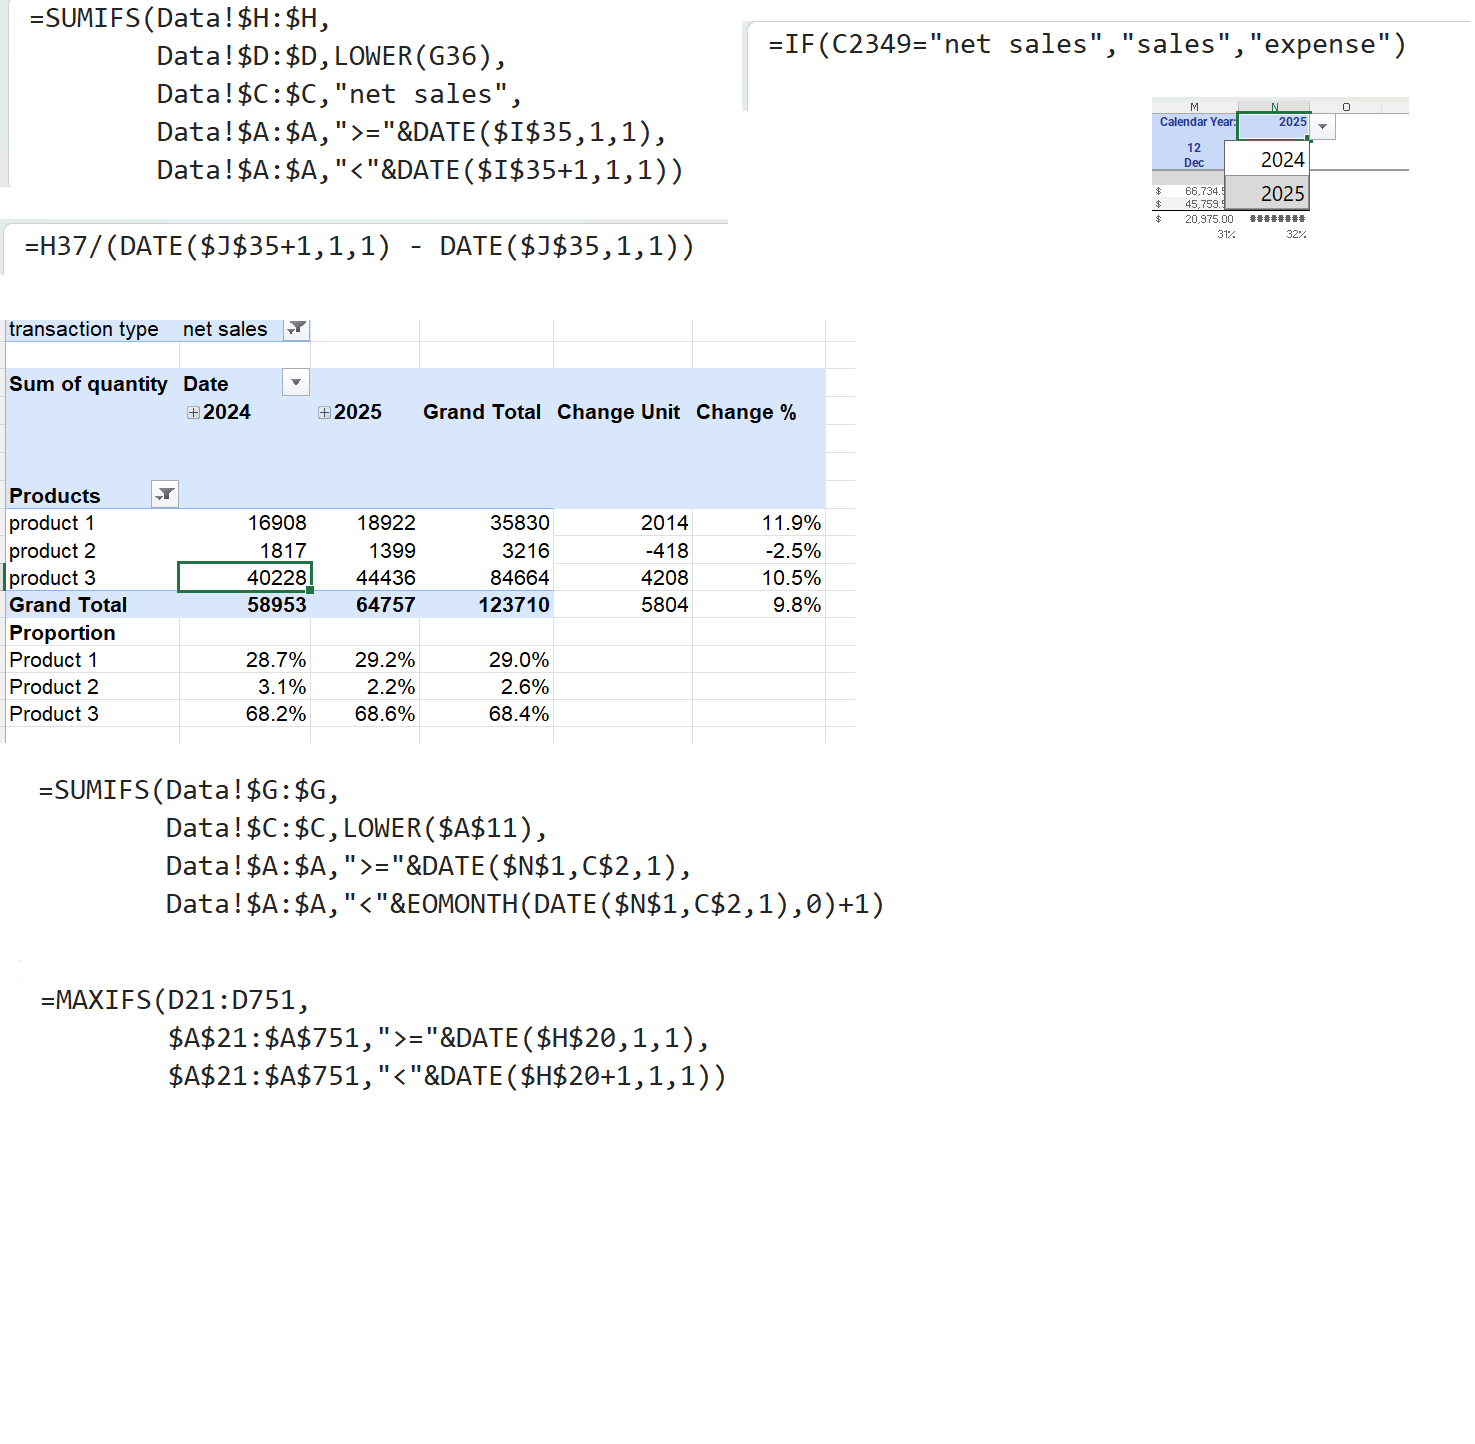
The analytical logic relies on advanced Excel modeling techniques:
Core Aggregation
- SUM and SUMIFS for conditional financial rollups
- MAX and MAXIFS for identifying peak performance metrics
Dynamic Referencing
- XLOOKUP for structured data retrieval
- GETPIVOTDATA for extracting values from PivotTables into calculation layers
Logic & Data Handling
- IF statements for conditional calculations
- EOMONTH and DATE for monthly financial grouping
- LOWER for consistent text matching
The formulas are designed to simulate database-style querying within Excel, enabling scalable reporting without manual adjustments.
Analytical Process
My workflow followed a structured analytics pipeline:
- Define business questions around profitability and operational efficiency
- Normalize raw transaction data into a consistent schema
- Build conditional aggregation logic to generate financial statements
- Create product-level pivots to connect sales activity with profit outcomes
- Compare year-over-year performance to identify trends and risk areas
This process mirrors how financial analytics projects are built in real data teams, translating raw operational data into executive-level reporting.
Key Insights & Value
The model highlights how profit performance depends not only on sales volume but also on expense structure and product mix. By separating revenue from operational costs and evaluating product-level profitability, the workbook enables stakeholders to:
Detect cost categories driving margin compression
So what: Understanding which expense categories are growing faster than revenue helps prioritize cost optimization efforts.
Identify top-performing products beyond raw sales numbers
So what: High-volume products don't always mean high-profit products — this analysis separates revenue drivers from profit drivers.
Evaluate operational efficiency across fiscal years
So what: Year-over-year trend analysis reveals whether operational improvements are translating into bottom-line results.
Outcome
This project demonstrates my ability to translate transactional datasets into structured financial analytics. It reflects my approach to building clear, reproducible reporting systems that combine technical accuracy with business storytelling — a core skillset for data analyst and business intelligence roles.