Case Studies
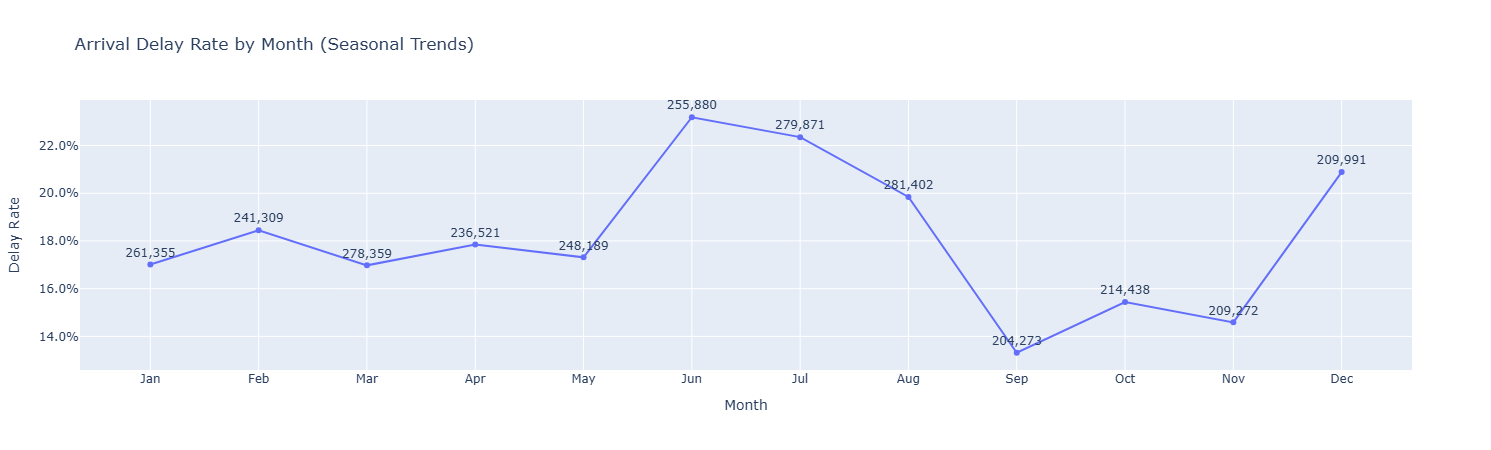
Airline Intelligence Platform (Personal Project)
Python ETL Pipeline & Flight Delay Analytics
Problem: 3M raw DOT flight records requiring structured end-to-end analytics
Approach: Built medallion ETL pipeline (Bronze → Silver → Gold), delay root-cause analysis, and arrival delay regression model
Result: Full analytical platform covering 18 carriers, 380 airports, and 5 years of on-time performance data
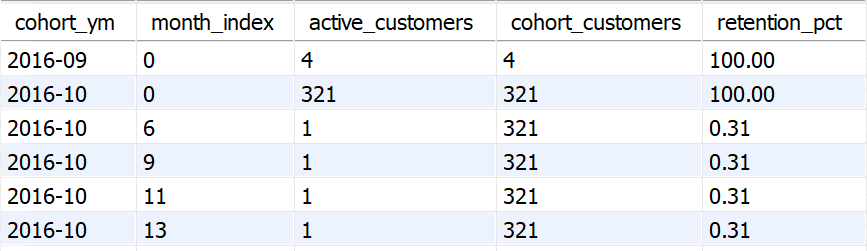
Olist Intelligence — Advanced SQL Analytics (Personal Project)
MySQL 8 Data Engineering & Cohort Analysis
Problem: Raw e-commerce data requiring structured analytics pipeline
Approach: Built production-style SQL pipeline with relational modeling and cohort retention analysis
Result: End-to-end analytics from CSV ingestion to business KPIs
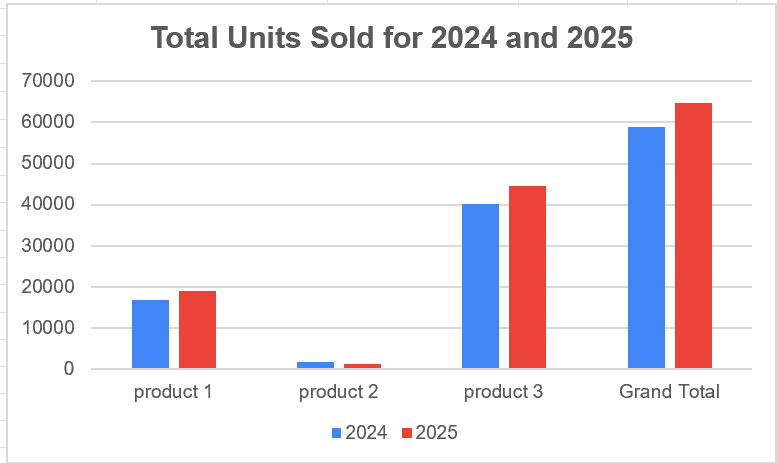
E-commerce Profitability Analysis (Udacity Guided)
Financial Modeling & Product Performance
Problem: Slowing profit growth despite steady sales activity
Approach: Built structured P&L statement from transaction data with YoY comparison
Result: Complete financial analytics enabling data-driven strategic decisions
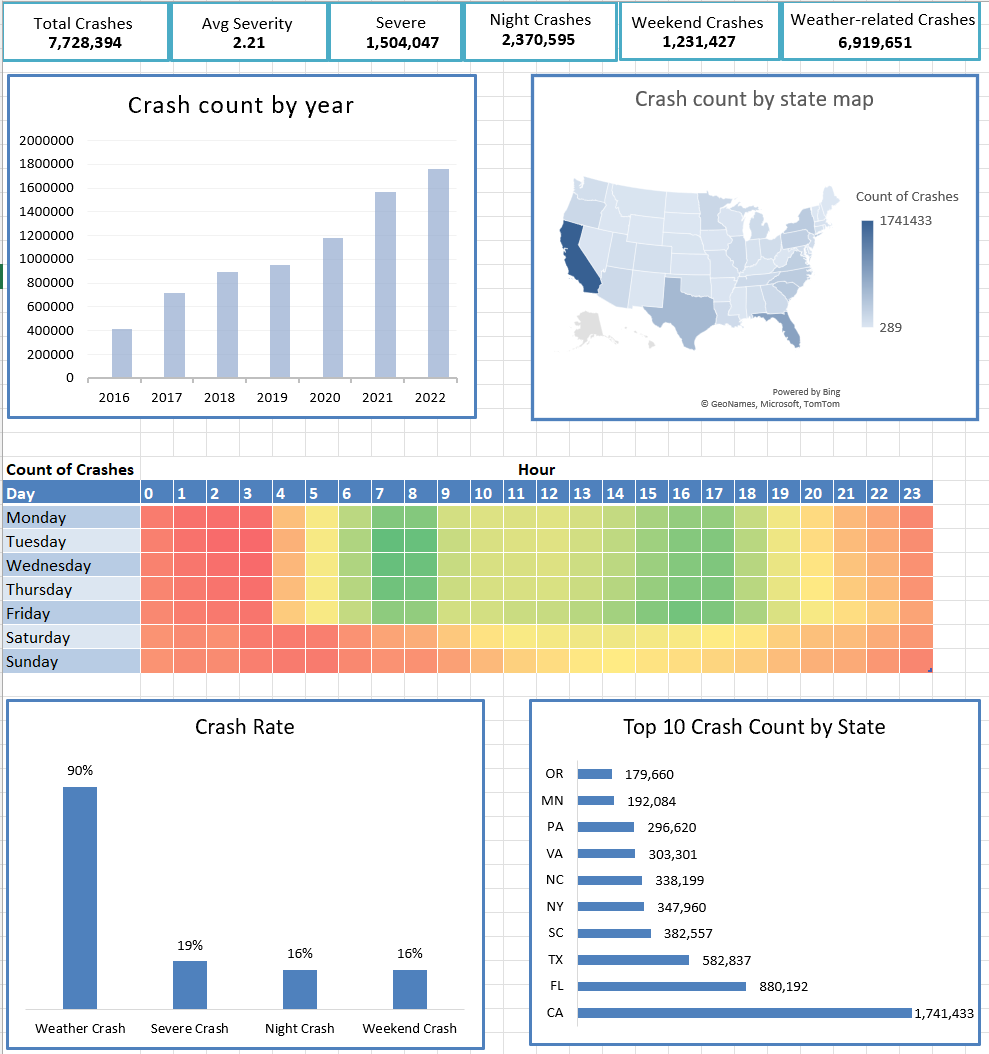
US Accidents Analysis Dashboard (Personal Project)
Safety Trends & Risk Insights (2016–2023)
Problem: Large accident dataset requiring structured safety analysis
Approach: Built interactive dashboard with KPIs, heatmaps, and geographic maps
Result: 7.7M+ crashes analyzed with clear temporal and regional patterns
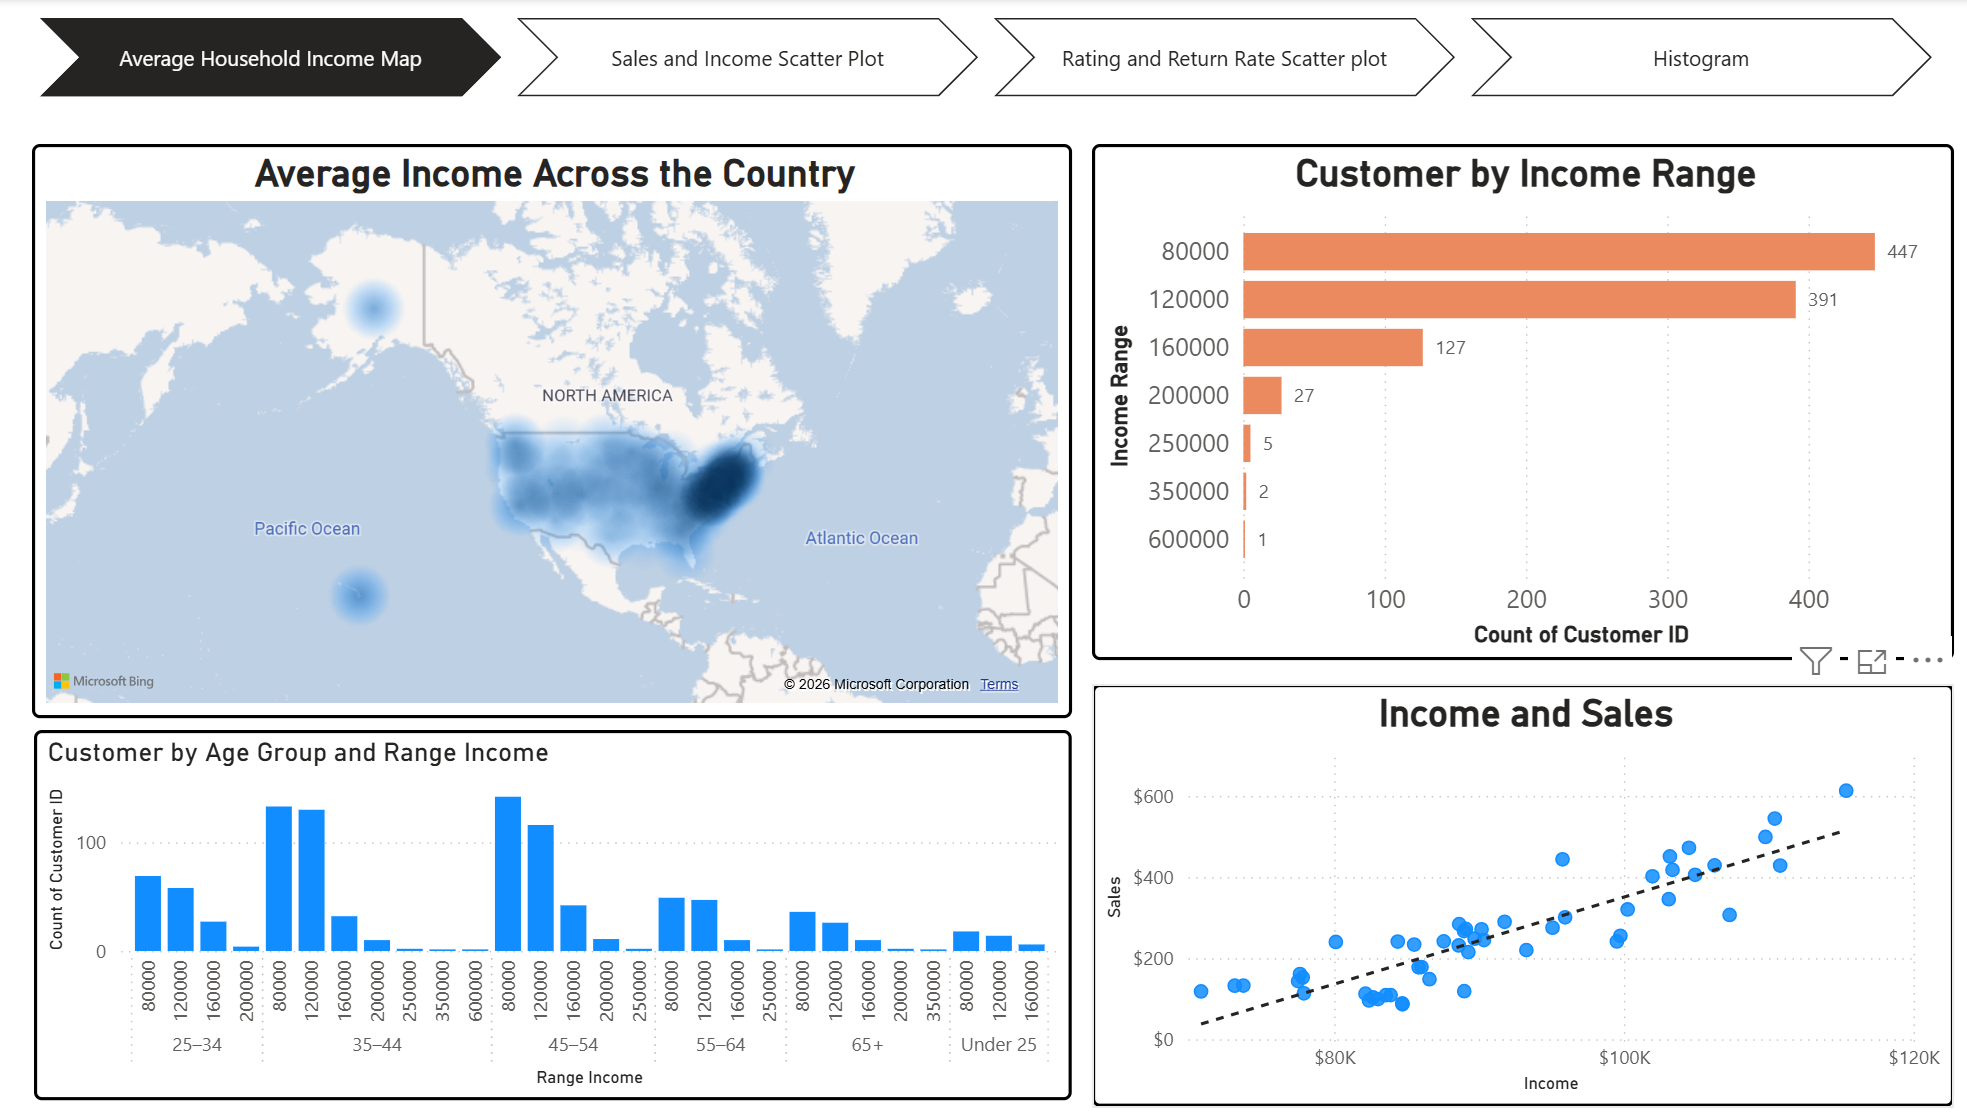
Customer Sales & Income Prediction (Udacity Guided)
Power BI Dashboard & Regression Analysis
Problem: Raw customer and product data requiring structured analytics
Approach: Built Power BI dashboard with data modeling, regression, and geographic heatmaps
Result: Income-sales correlation (0.78) and product recommendation insights
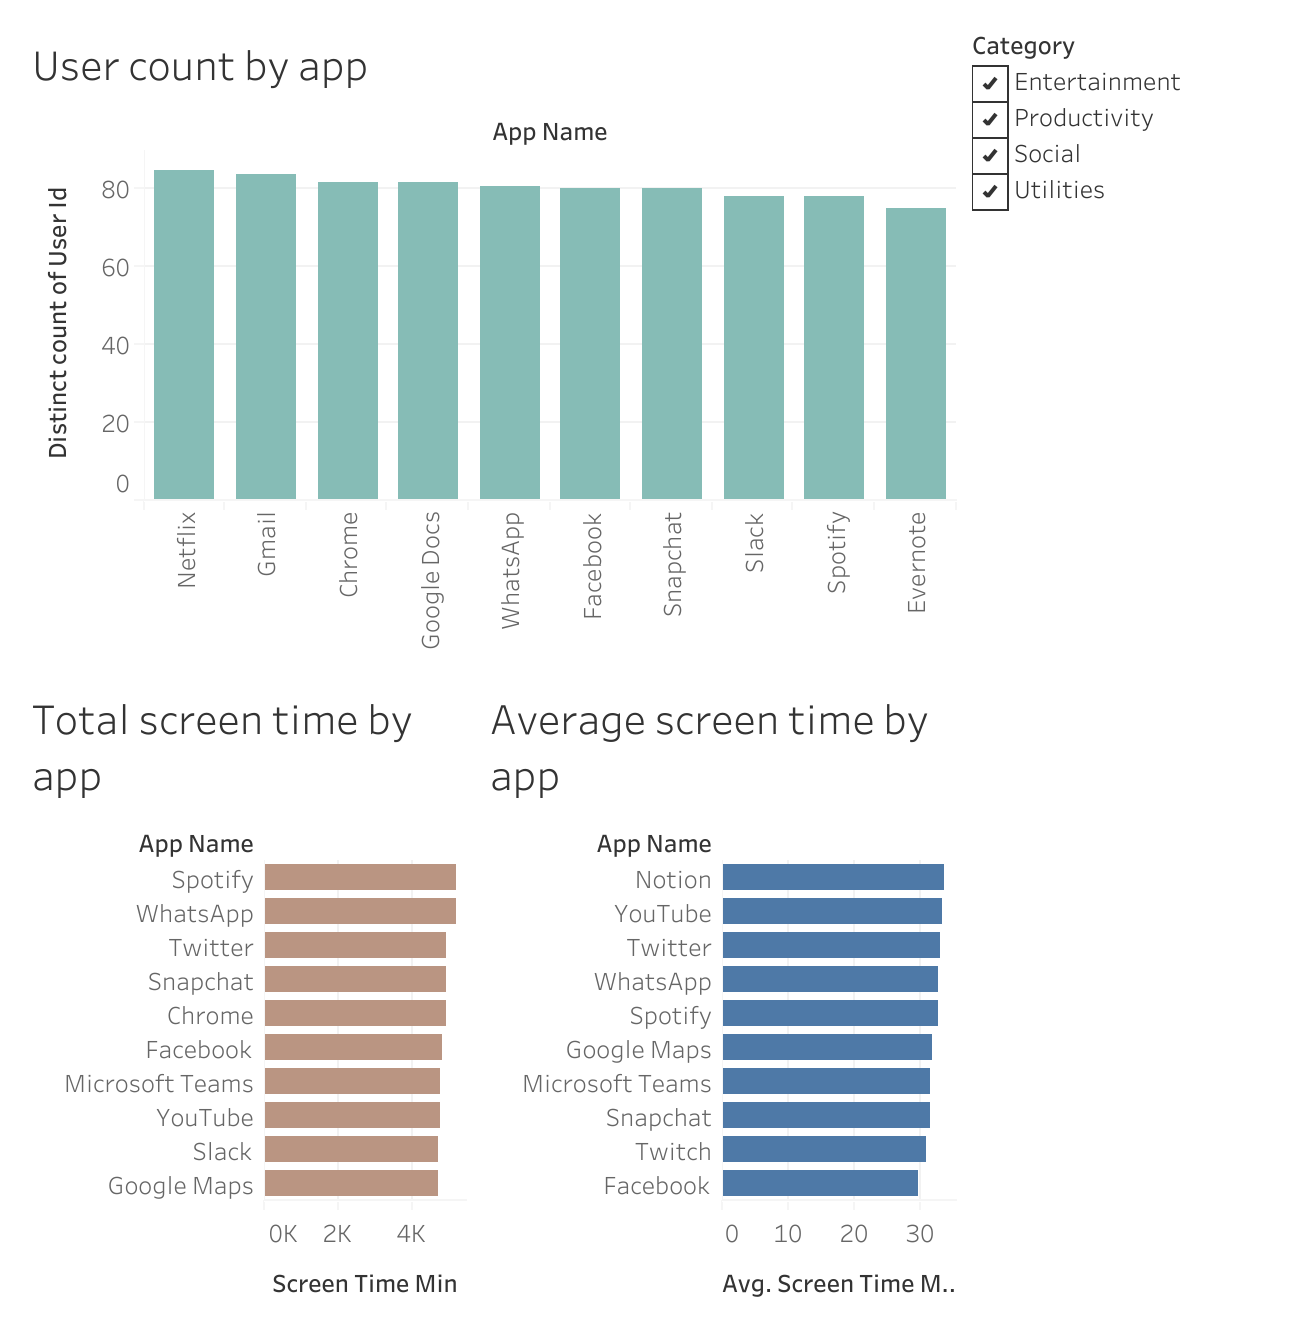
Screen Time & App Usage (Udacity Guided)
Tableau Analytics Dashboard
Problem: Understanding mobile app behavior and engagement patterns
Approach: Built Tableau dashboard with heatmaps, regression analysis, and behavioral segmentation
Result: Identified two distinct usage patterns and 75% non-productive screen time