Project Overview
This project analyzes the US Accidents (2016–2023) dataset from Kaggle to identify nationwide crash trends, high-risk regions, and behavioral patterns across time. The goal was to transform a large real-world public safety dataset into a structured analytical dashboard that highlights when, where, and why accidents occur.
Using Excel analytics, PivotTables, and calculated KPIs, the dashboard converts millions of accident records into executive-level insights that support transportation planning, safety awareness, and risk analysis.
Dataset
The dataset includes:
- Crash timestamps (date, day of week, hour)
- State and geographic information
- Severity levels
- Weather conditions
- Night vs daytime indicators
- Weekend indicators
This project focuses on trend analysis, crash distribution, and environmental risk factors.
Business Objective
Traffic safety agencies and analysts need a clear understanding of crash patterns to make data-driven decisions. Raw accident data is large and difficult to interpret without structured analysis.
Key questions addressed:
- How have crash counts changed year-over-year?
- Which states experience the highest crash volumes?
- What times of day show peak accident risk?
- How much do weather conditions contribute to incidents?
- Do night driving or weekends significantly increase risk?
Dashboard Features
KPI Summary Panel
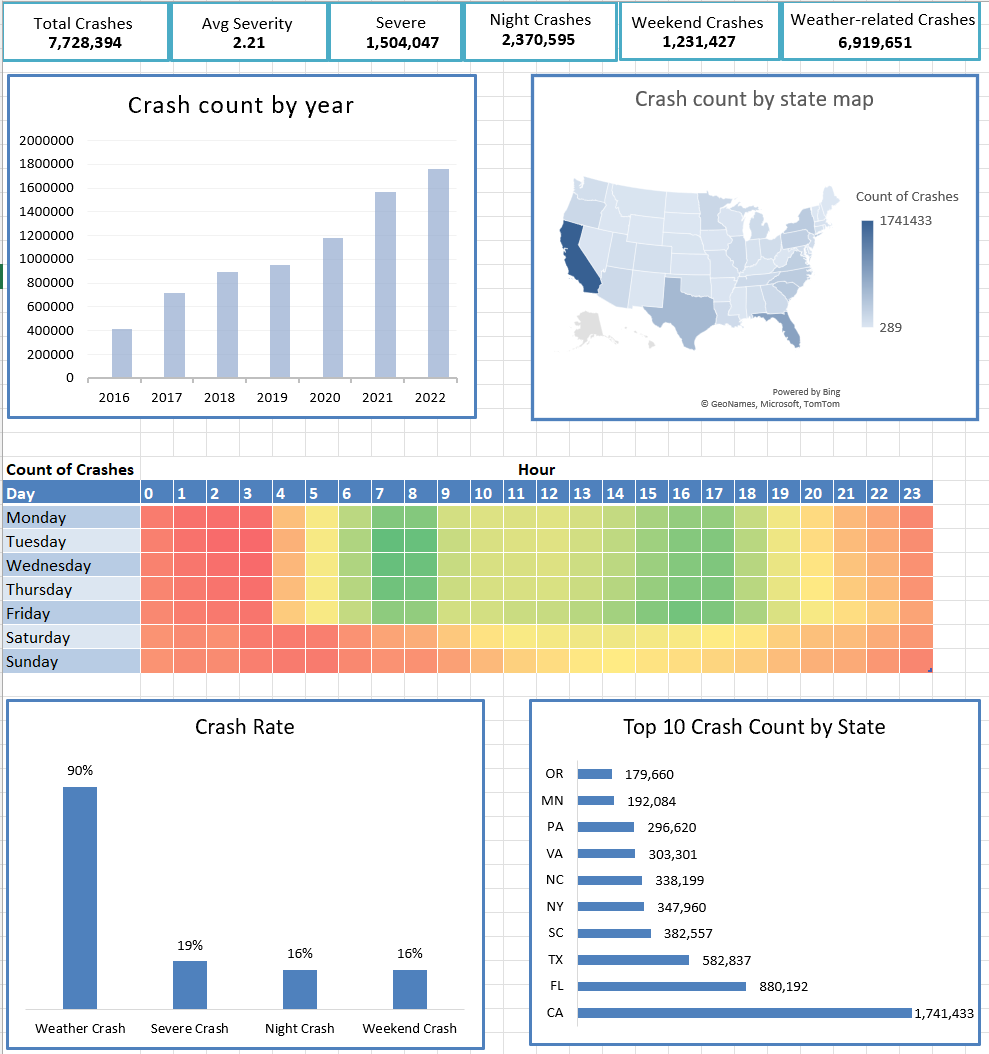
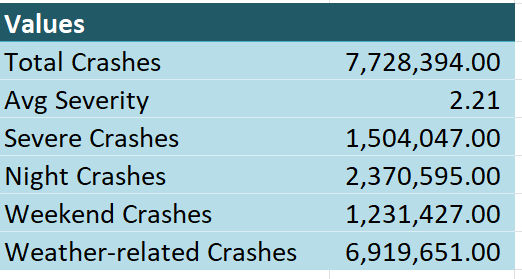
The dashboard presents high-level performance metrics including:
- Total Crashes: 7.7M+
- Average Severity: 2.21
- Severe Crashes: 1.5M+
- Night Crashes: 2.3M+
- Weekend Crashes: 1.2M+
- Weather-related Crashes: 6.9M+
These KPIs provide an instant overview of national safety trends.
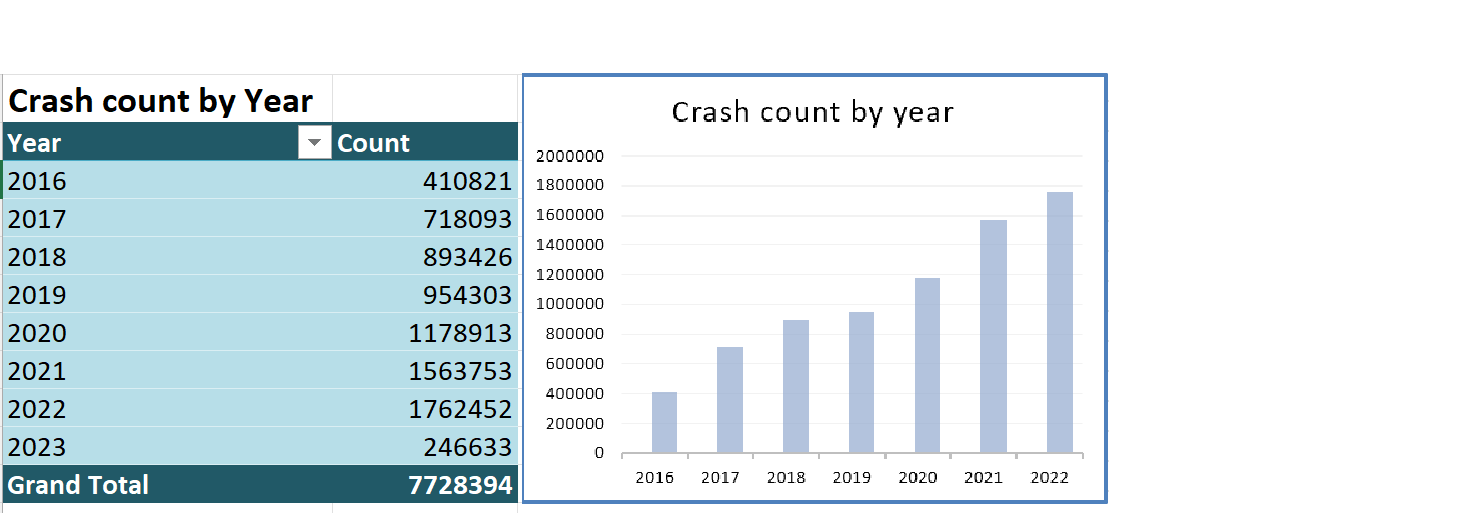
Crash Trend Analysis (Yearly)
A year-by-year crash count visualization highlights the growth in reported accidents from 2016 through 2022, allowing viewers to quickly identify upward trends and potential external influences such as traffic volume or reporting changes.
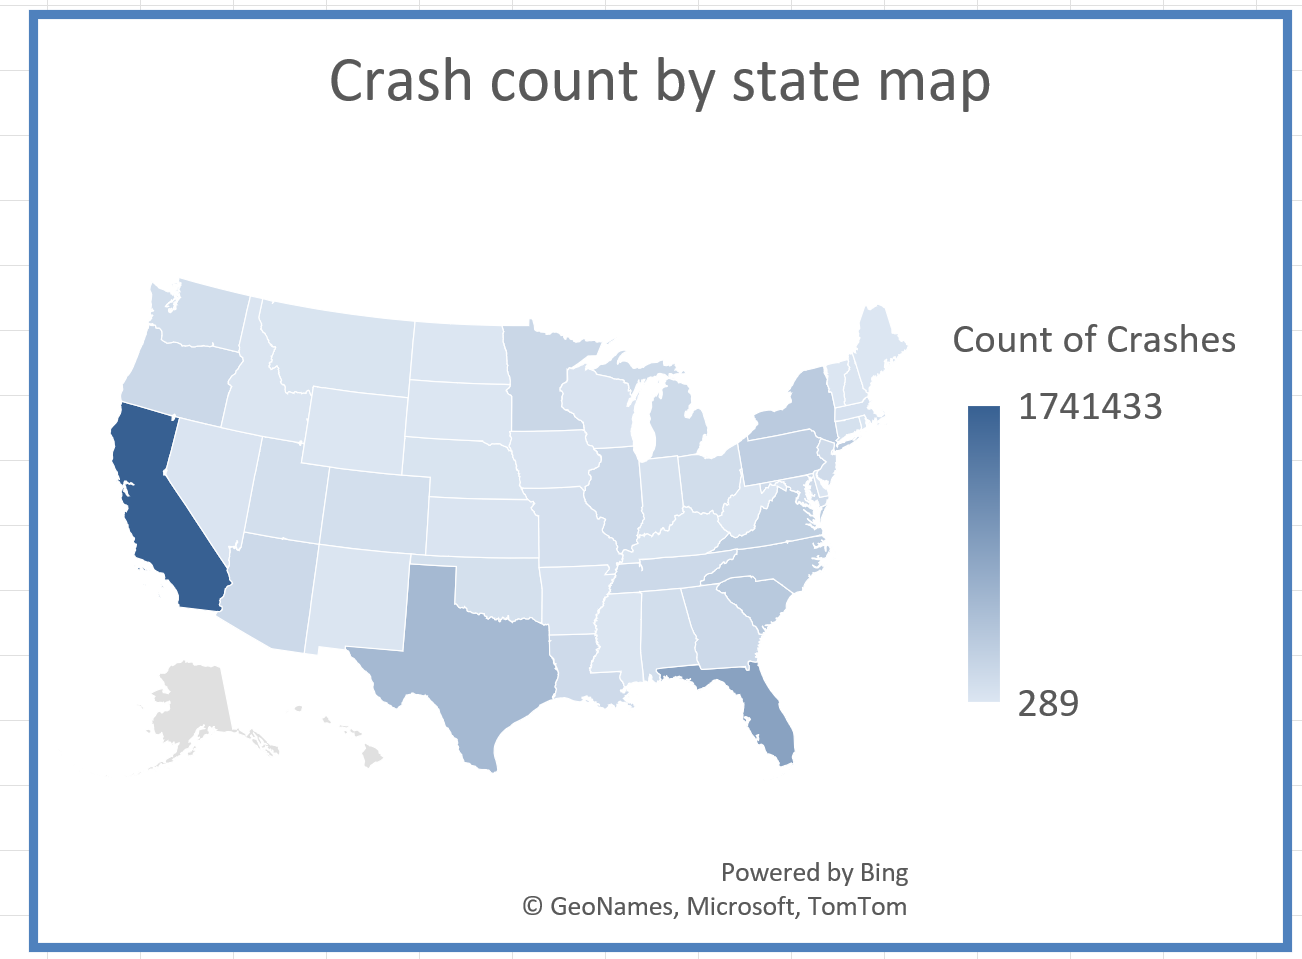
Geographic Risk Analysis — State Map
A choropleth map visualizes crash counts across US states, revealing regional hotspots.
Key observations:
- California leads in total crash volume
- Florida and Texas also show significantly high incident counts
- Geographic distribution highlights population density and traffic exposure
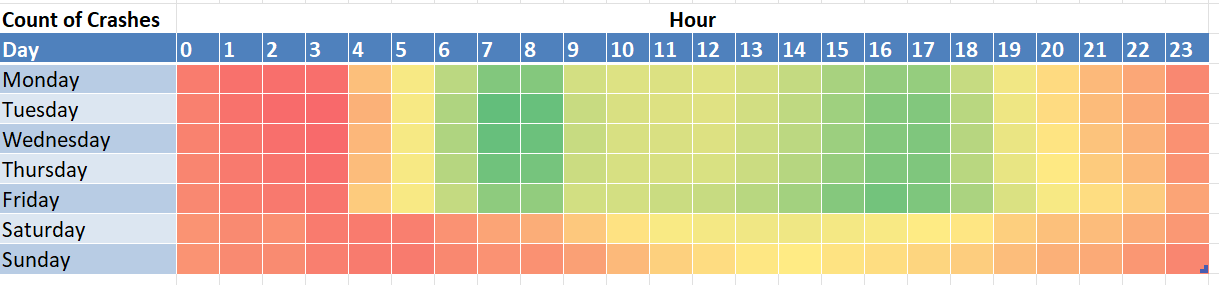
Time-of-Day & Weekly Behavior — Heatmap
A day-of-week vs hour heatmap reveals behavioral patterns in accident occurrence.
Insights include:
- Higher crash frequency during morning and evening commute hours
- Weekday peaks differ from weekend patterns
- Early morning and late-night hours show lower activity but different severity risk profiles
Crash Type Analysis — Rate Comparison
A rate comparison chart evaluates the proportion of crashes linked to weather conditions, night driving, weekend travel, and severe incidents.
Weather-related crashes account for the largest share, suggesting environmental conditions are a dominant risk factor.
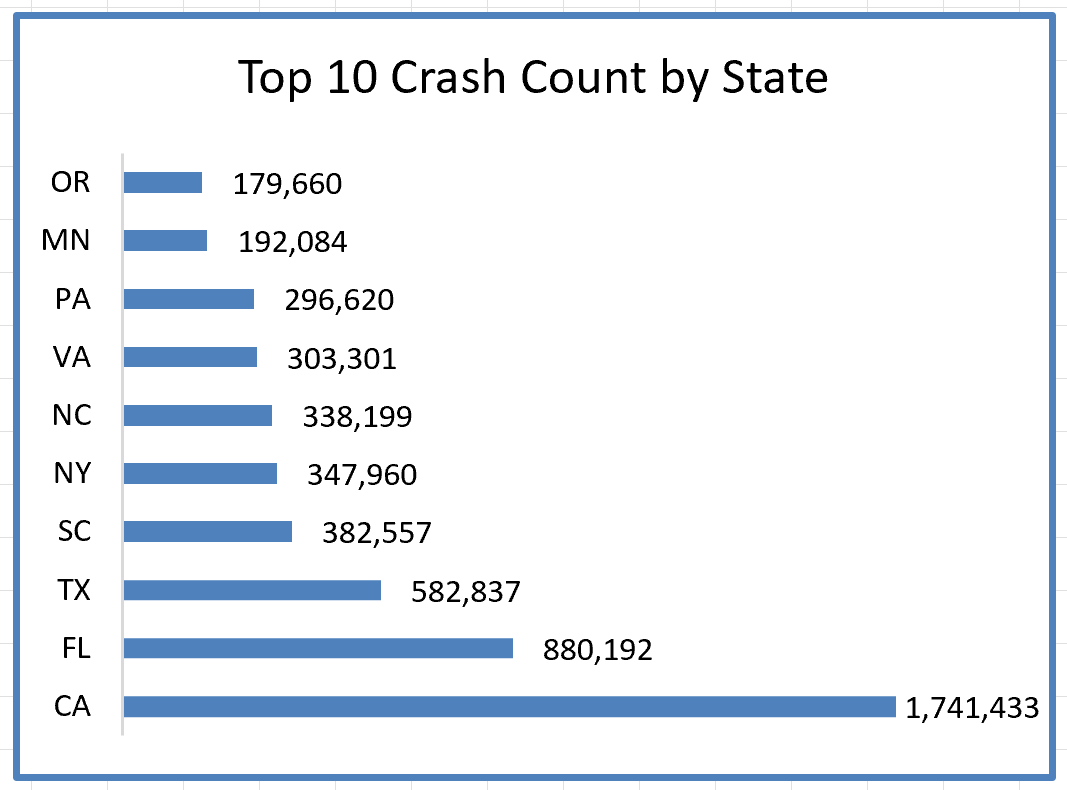
Top States Comparison
A ranked bar chart highlights the Top 10 states by crash count, enabling quick benchmarking between regions.
Technical Implementation
The dashboard was built using structured Excel analytics techniques:
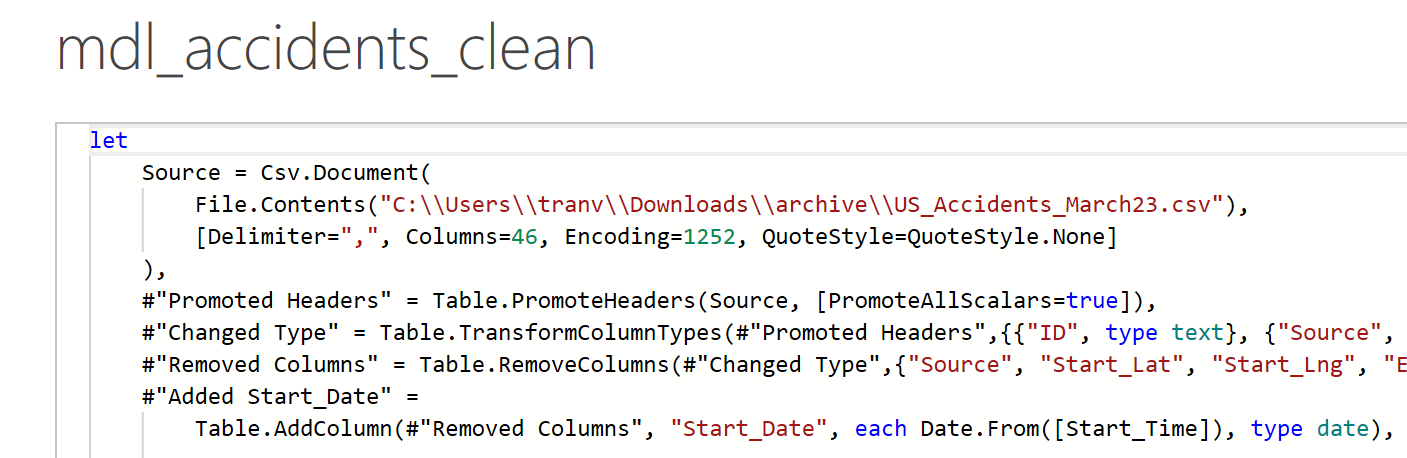
Data Import — Power Query
With 7.7M+ records, the dataset exceeds Excel's native row limit of ~1 million rows. Power Query was used to:
- Connect to the large CSV source and filter data at import
- Apply transformations (date parsing, text cleaning) before loading
- Aggregate records into summary tables that Excel can handle efficiently
- Enable refresh capability for updated data sources
Data Modeling
- PivotTables for multi-dimensional aggregation
- Derived KPI tables for performance tracking
- Slicers for interactive filtering by year and state
Visualization
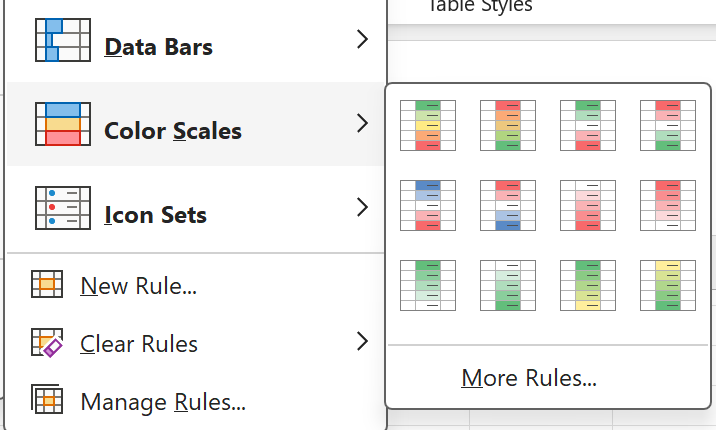
- Heatmap built with conditional formatting
- Choropleth state map visualization
- Interactive filtering using slicers
The design focuses on translating millions of records into a clear decision-support interface.
Analytical Workflow
My approach followed a structured analytics pipeline:
- Import and structure large-scale accident data
- Define KPIs aligned with safety analysis objectives
- Build PivotTables to aggregate temporal and geographic trends
- Create calculated metrics to evaluate crash types and risk factors
- Design interactive visuals to communicate insights clearly
This workflow mirrors real-world data analyst responsibilities, combining data cleaning, aggregation, and storytelling.
Key Insights
Upward Crash Trend
Crash volume shows a steady upward trend over multiple years, indicating growing traffic exposure or improved reporting coverage.
Weather as Dominant Risk Factor
Weather conditions are associated with a significant percentage of incidents, highlighting the need for weather-aware safety campaigns.
Commute Hours Drive Peak Risk
Peak accident times align closely with commuting hours, suggesting targeted enforcement and awareness during rush periods.
Population Density Correlation
High-population states dominate total crash counts, emphasizing exposure risk tied to traffic volume rather than inherently unsafe driving.
Outcome
This project demonstrates my ability to transform a large public dataset into an interactive analytics dashboard. It highlights my strengths in data modeling, visualization design, and translating complex datasets into clear, actionable insights — essential skills for data analyst and business intelligence roles.