Project Overview
This project uses Microsoft Power BI to analyze customer income, purchasing behavior, product performance, and geographic trends. The goal was to transform raw customer and product data into actionable business insights through structured data modeling and visual analytics.
Key Goals
- Clean and transform raw data using Power Query
- Build relational data model for cross-filtering
- Analyze income-to-sales correlation patterns
- Identify product recommendation trends
- Visualize geographic income distribution
Data Cleaning (Power Query)
Data preparation was performed in Power Query Editor before building visuals:
- Removed unnecessary or inconsistent columns
- Corrected data types for income, sales, and ratings
- Structured income ranges and age groups
- Standardized product and state fields
- Prepared regression variables and calculated fields
Why clean at query stage? Cleaning data in Power Query ensures faster dashboard performance and accurate aggregations inside visuals.
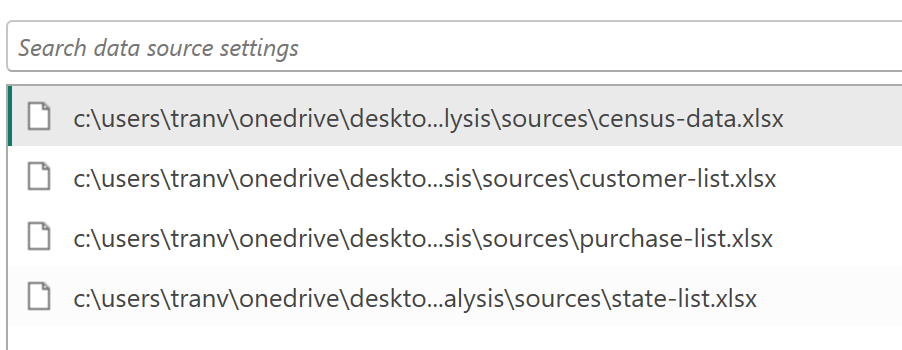
Power Query Editor showing data cleaning and transformation steps
Data Modeling & Relationships
After cleaning, tables were loaded into the Power BI Data Model where relationships were created between:
- Customer table
- Sales metrics
- Product data
- Geographic/state fields
Key benefit: These relationships enabled cross-filtering between visuals, accurate counts, and consistent analytics across maps, charts, and regression visuals.
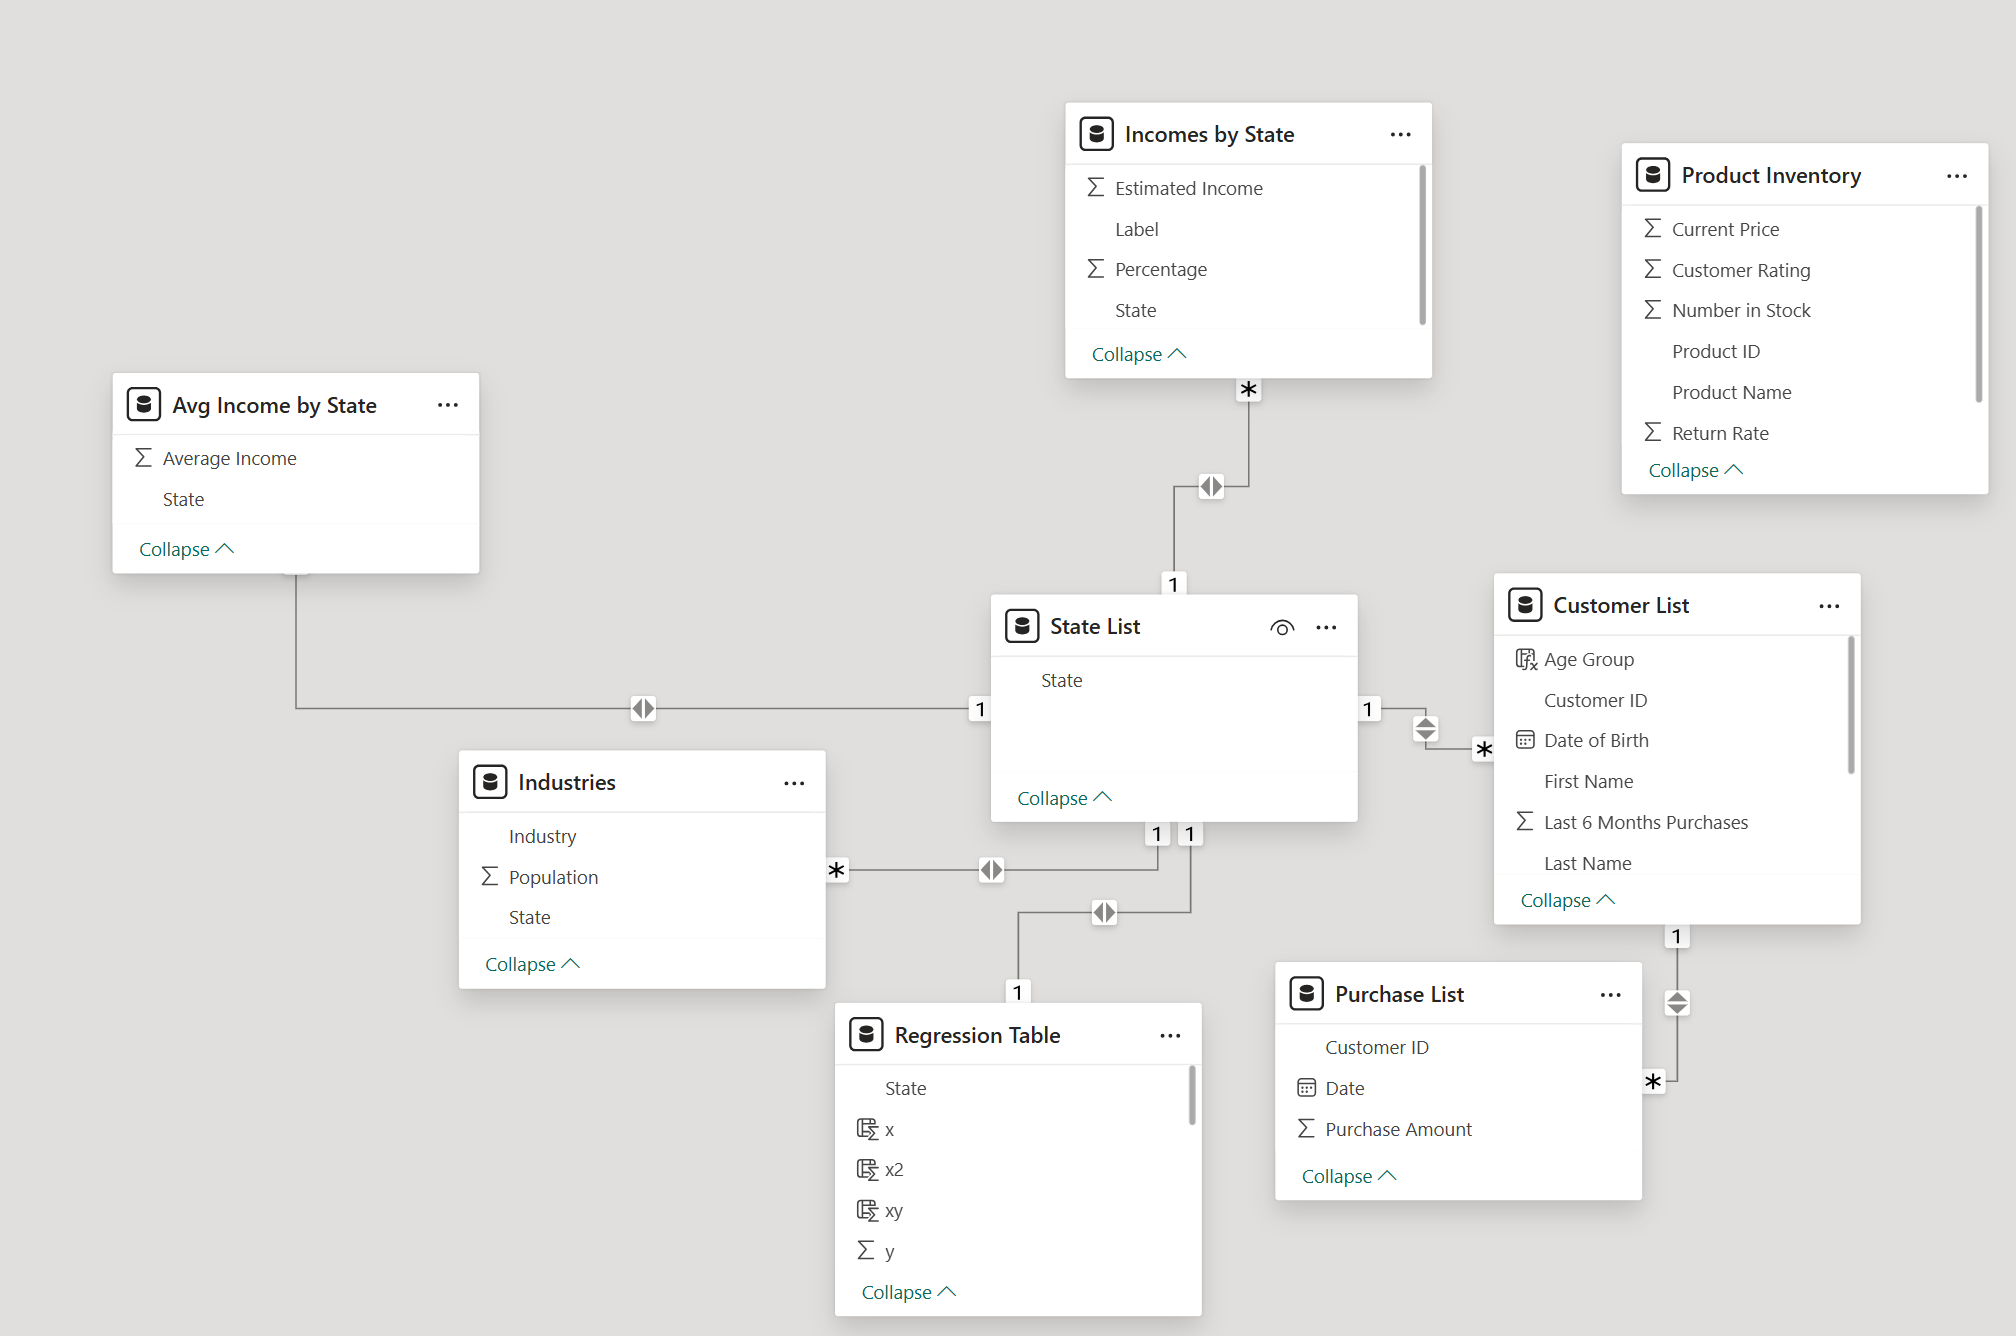
Data model showing relationships between Customer, Sales, Product, and Geographic tables
Dashboard Analysis
Income & Sales Regression
Scatter plot analysis shows a strong positive relationship between income and sales:
Insight: Higher-income customers generate higher purchasing values. Every $1,000 increase in income corresponds to approximately $10.73 in additional sales.
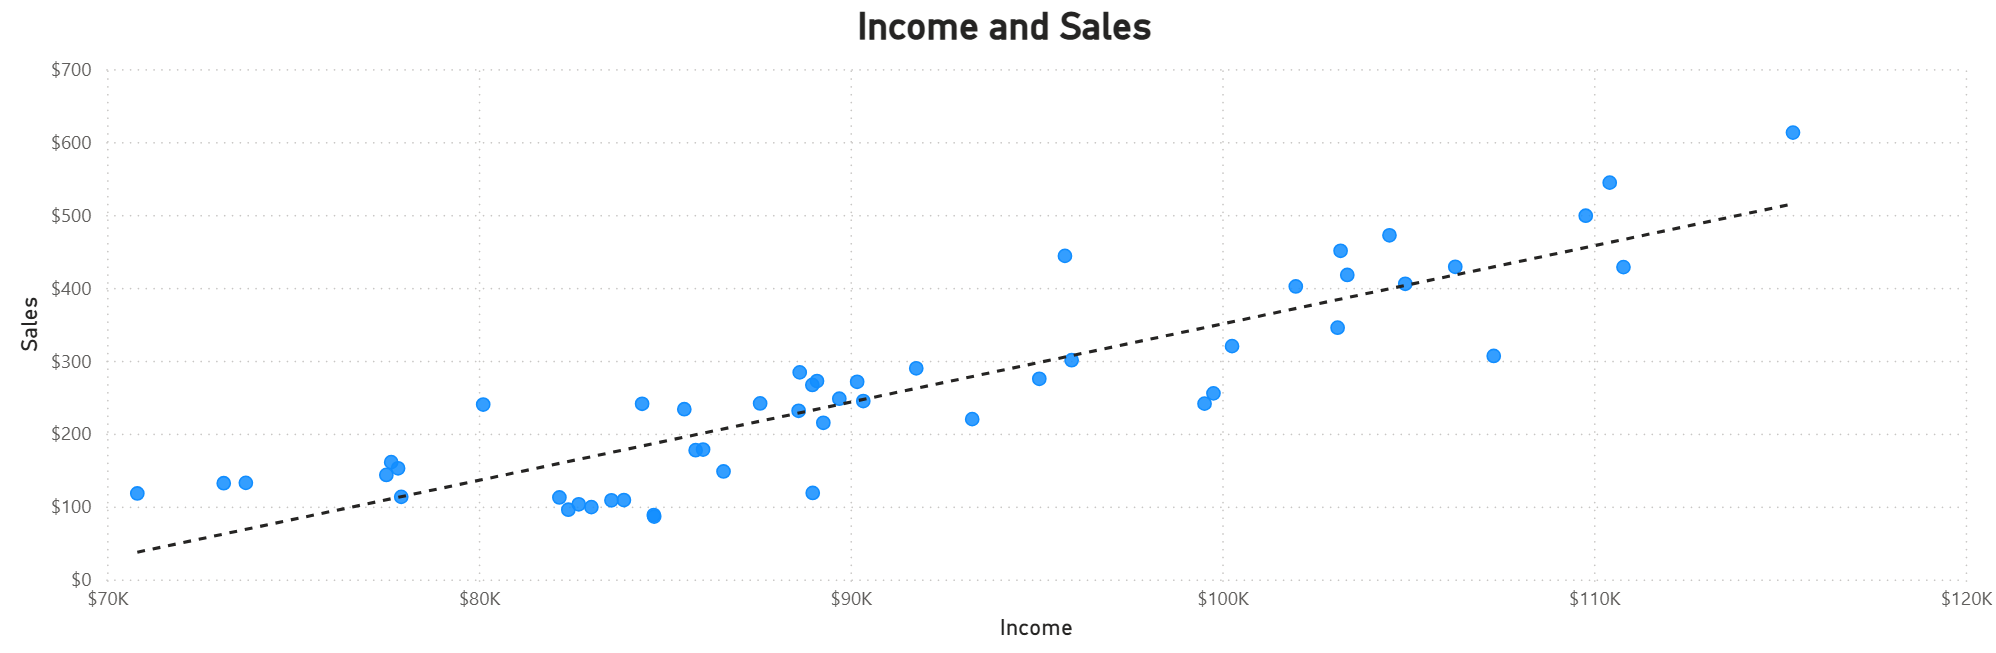
Scatter plot showing strong positive correlation (0.78) between customer income and sales
Customer Rating vs Return Rate
Return rate and customer rating display a negative correlation:
Products with higher ratings show significantly lower return percentages, visible in scatter and product comparison visuals.
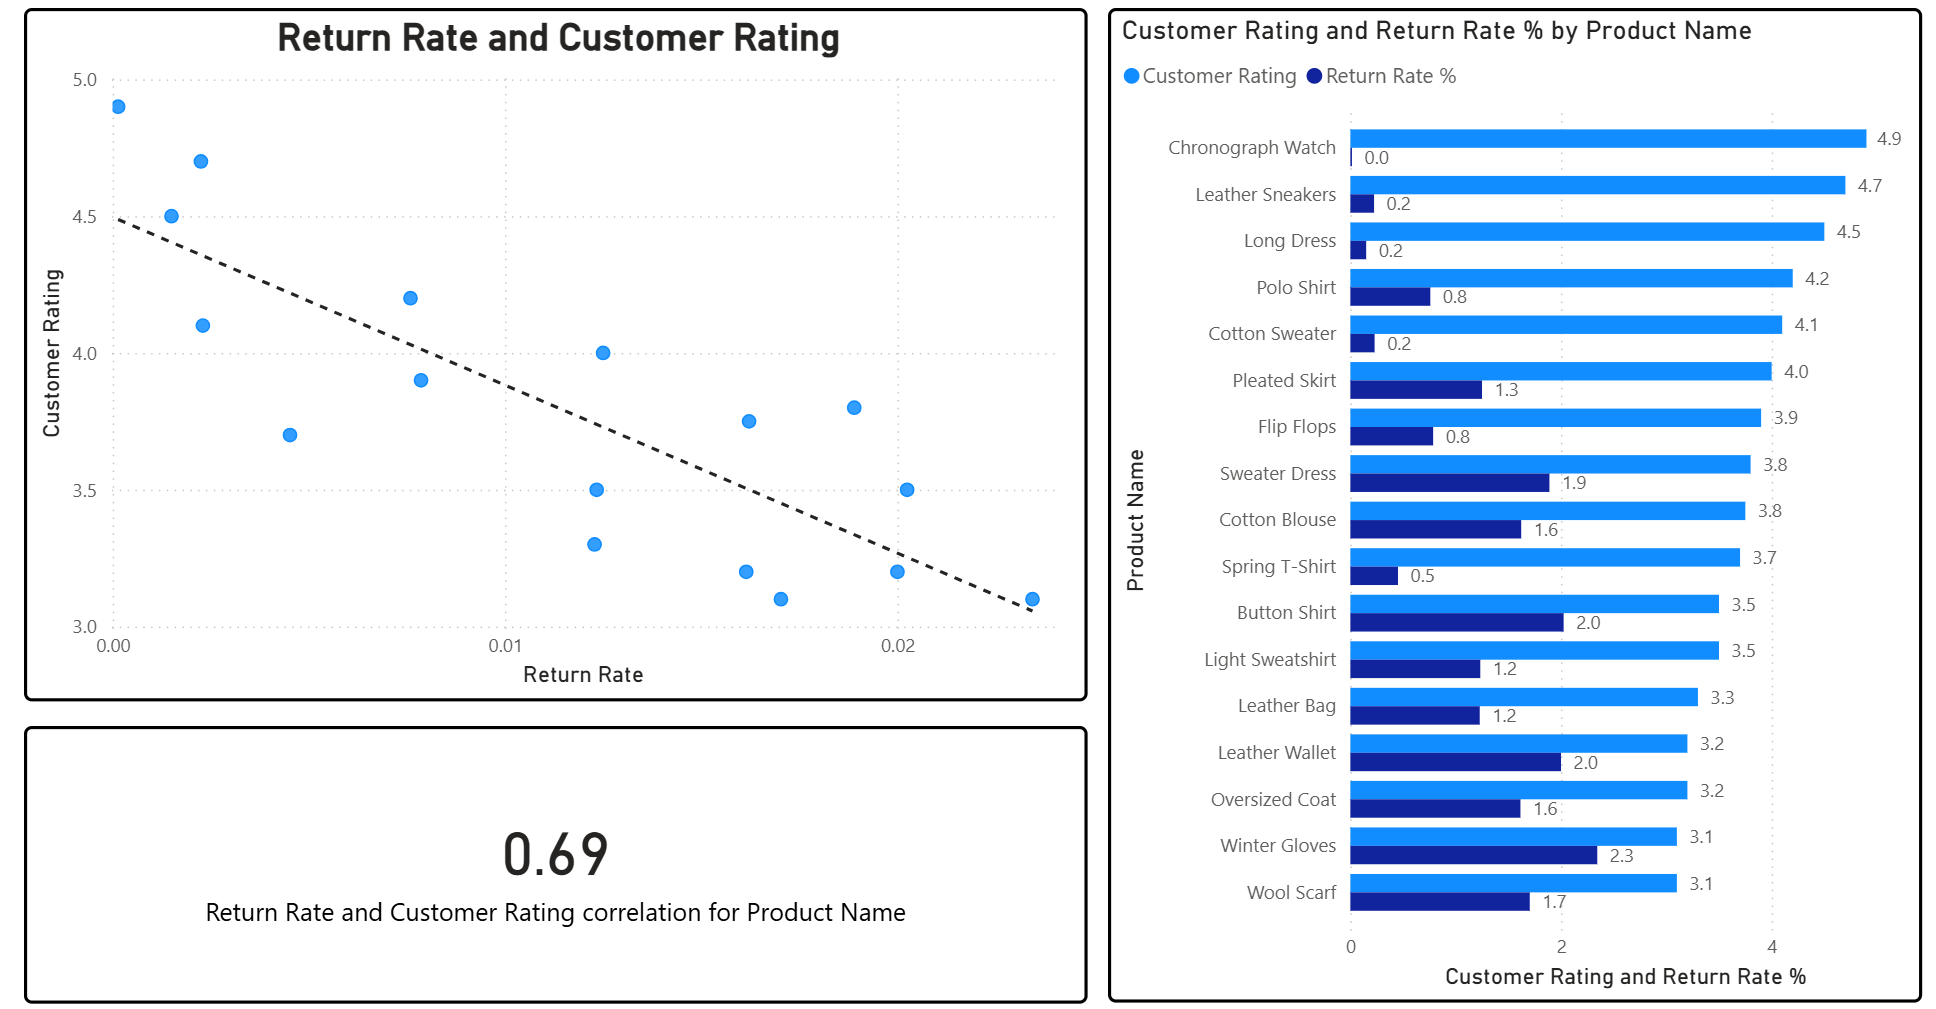
Scatter plot showing negative correlation between customer ratings and return rates
Customer Distribution
Income heatmap highlights higher earning regions across the country, with concentration in Illinois and New Jersey aligning with higher product recommendation activity.
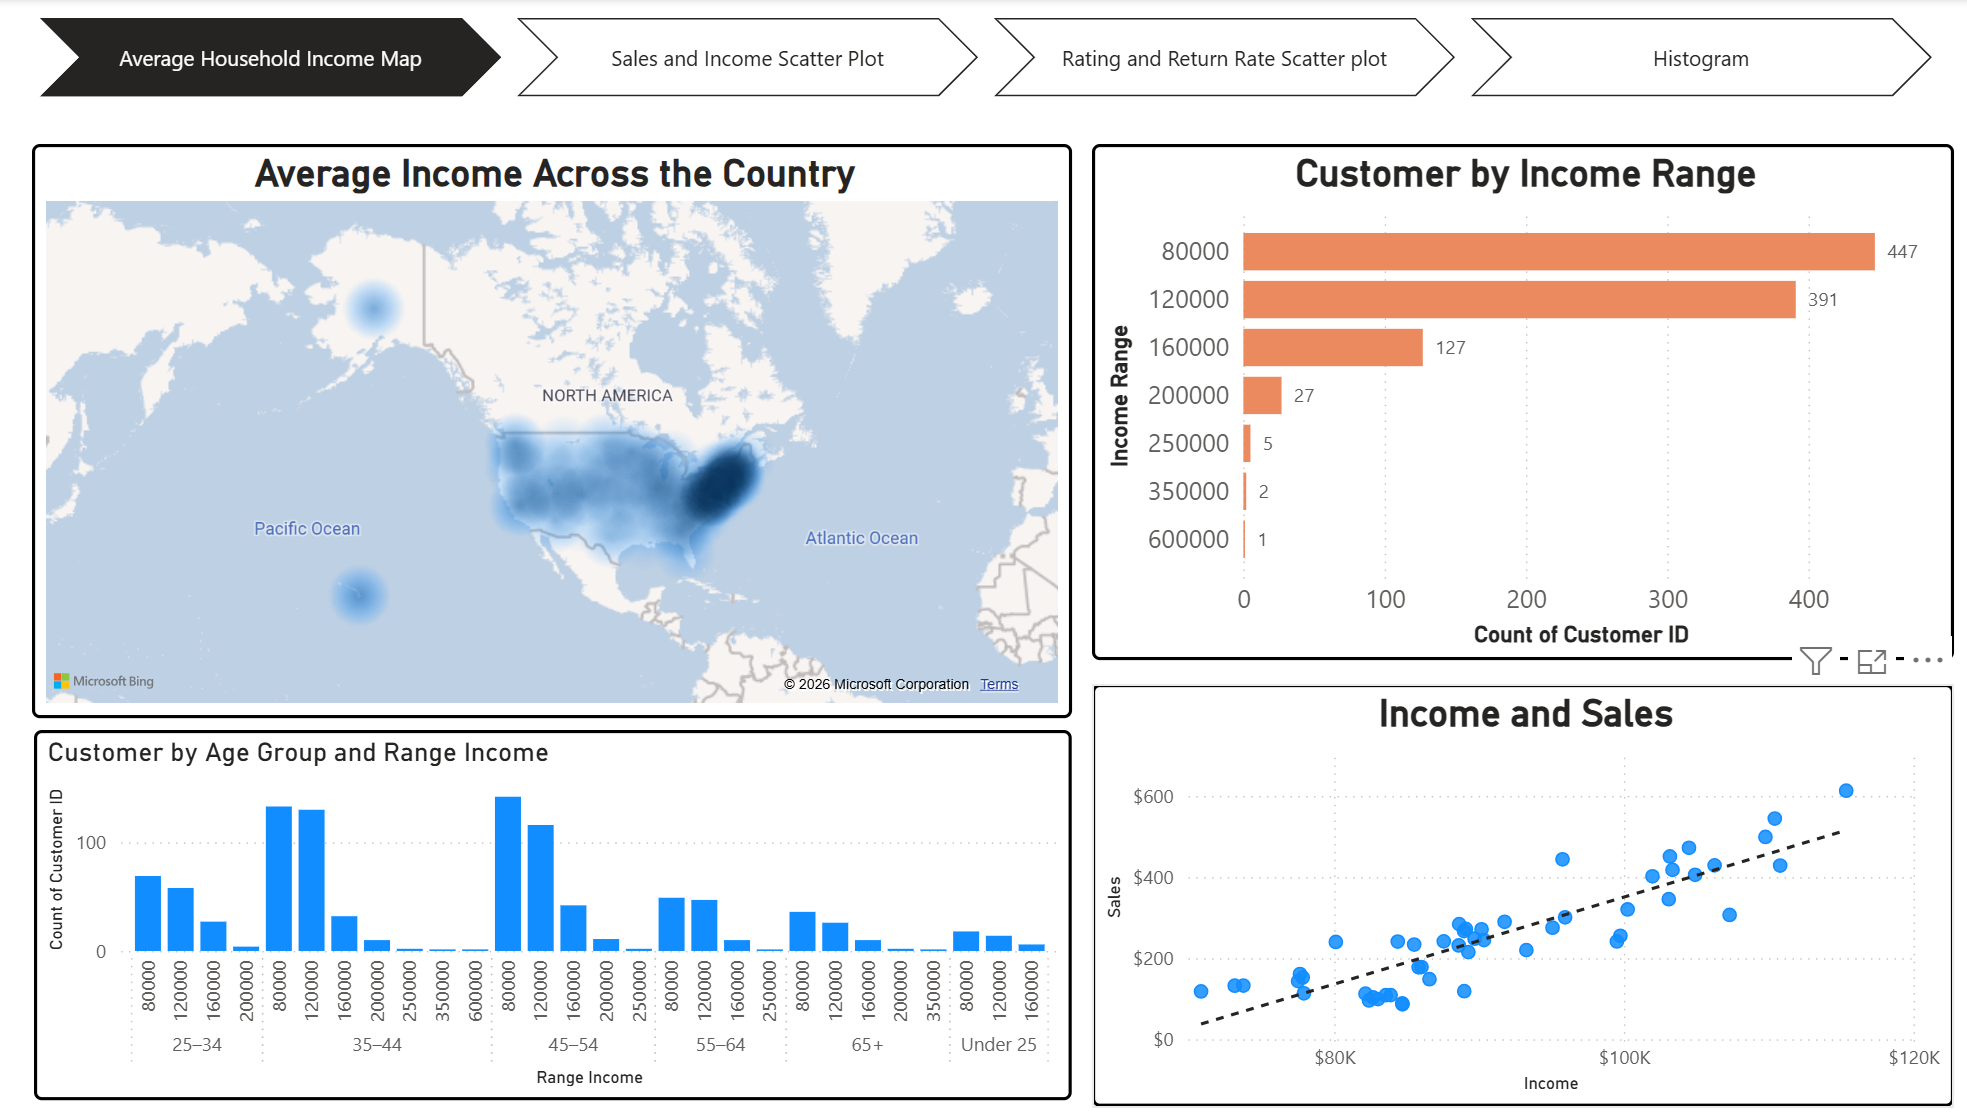
National heatmap showing income concentration by state with Illinois and New Jersey highlighted
Product Recommendation & Inventory
Top Recommended Products
Inventory Highlights
Analysis highlights the following products with highest stock levels:
- Long Dress — Highest inventory
- Wool Scarf — High stock
- Sweater Dress — High stock
Geographic insight: High-income states show strong Leather Bag preference, suggesting targeted marketing opportunities.
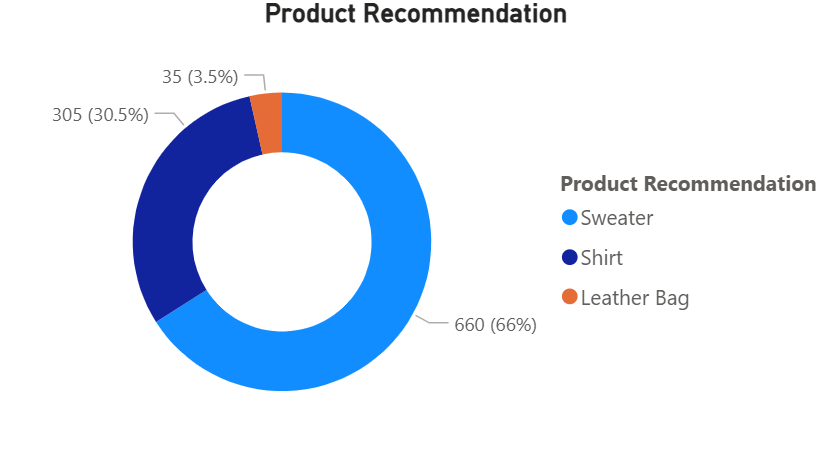
Product recommendation breakdown showing Sweater as top recommended item (66%)
Tools & Techniques
Key Insights
💰 Income Drives Sales
Strong 0.78 correlation confirms higher-income customers generate significantly higher purchasing values.
⭐ Quality Reduces Returns
Products with higher ratings show lower return rates, validating investment in product quality.
🎯 Target Demographics
Core customer base is 35–54 years old with $80K–$120K income — ideal for marketing focus.
📍 Geographic Targeting
Illinois and New Jersey show highest income concentration and product recommendation activity.